BLOG

Hello again! This article is part of a series, so if you just discover this, I strongly recommend you start from the beginning. Let’s continue digging through the visual.json files. Today we’ll extract the fields used in visuals and we’ll figure out a way to extract the the first column of field parameters, where we set up the names we want to use. Yes, we’ll need to translate these as well.

Continue Reading..

Hello again,

after some inactivity the blog is flourishing again.  It’s not really something I control. When there’s something I want to write in the blog, I suddenly imagine all the bloggers out there about to write the exact same blog post elsewhere, so I just need to do it, and do it fast. This is something I’ve been doing for real, but really applies in general so I think many can benefit from it. I’ve been asked to take *the* report and make it bilingual. But bilingual for real, so this includes everything: Titles, legends, data, everything. This is a topic that has been addressed a number of times,  and yes, there are demos out there. However, the use cases presented in general are either very simple or they start with a project that from the start was known that it had to be bilingual. The reality is, though, rather more complex. I’ll try to write as I progress through this project once I have figured each one of the steps. Let’s do it.

Continue Reading..

Hello again!

I’m back with the other use case I have in mind for Report-layer scripts. If you haven’t read yet my previous blog post I recommend you do this now as we’ll be building on that with a more complex use case. When I first managed to develop C# in visual studio I rushed to write something I could not build by adapting code snippets only. I made a script that iterated the model relationships and built measures to detect invalid relationships. Not only that, if you build the proper table with the column of the «many» side of the relationship with the measure, you can identify who are the offending values and take action. The script is cool as it is, but again, building each of the tables is quite a pain. Let’s see if we can automate this one. This time I’ll be writing as I author the script. Let’s see how it goes.

Continue Reading..

Hello!

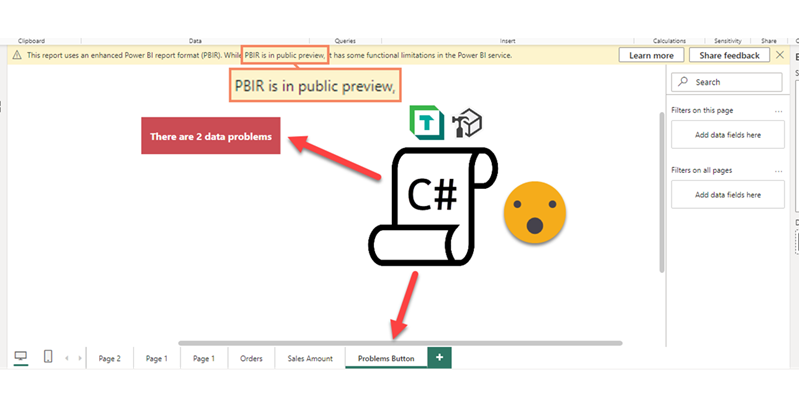
Today’s post is quite special for me as I wished that this day would come. When I wrote the article to generate the measures for a dynamic data problems button there was a section that read «So, let’s build this button then. This part, unfortunately cannot be scripted, so we’ll need to work a little bit.». Well, maybe this is a thing of the past. Let’s see how can we script this part too. Before going diving in though I want to thank Xavi Paterna for helping me out with his tremendous knowledge of C# programming.

Continue Reading..

Hello there!

Today’s post comes from an actual requirement that I had heard before but never handled directly. There is some nifty DAX and modeling so lets get to it!

Continue Reading..

UPDATE: I was kindly asked by Kerry Kolosko to make a Work-Out-Wednesday challenge for this chart, and when I did, I realized that it’s much more simple than I laid out on this article. I keep as proof that finding the best approach is an iterative process! Building the model from scratch also helps. Check out the challenge (and explanation video) here!


Hello there! Time is crazy and I haven’t been updating the blog as much as I’d like to. But here I am and I hope you enjoy it.

This 2024 I took the decision to step up my involvement at Power BI User Group Barcelona and started organizing online events from international speakers. For those that present in English I even do some live interpretation that is recorded and remastered with the video stream so that we get the renowned presenters in both English and in a not-perfect Spanish translation (check out the events here and the recordings here). But why am I speaking about that? Well, first of all to brag about it because these sessions have been awesome, but also because the most recent one is the starting point for this blog post.

Continue Reading..

Hello everyone

With sqlbits, Easter holidays and a bunch of other stuff i haven’t posted in a while, but I’m back!

Full disclosure, this is a sponsored post, but for a good cause, you’ll see in a minute.

If you follow me on Twitter you’ll know I like swag almost as much as Johnny Winter, and man there was a LOT of swag at sqlbits!

And among all the swag, there is a type of swag that every sponsor and plenty of attendees are into: stickers! Stickers are over the place. Many of the fellow attendees had also plenty of carefully curated collection of stickers on their laptops.

I have around 8 stickers so far on mine, very proud of each of them. The latest member is a sticker from Tabular Editor 3! But I have to confess that the one I’m most proud ofis the one of PUG Barcelona 😀

At PUG Barcelona we have a lively whatsapp group –285 members as of today– where the group exists everyday, so it’s not just the events. We share doubts and resources and we congratulate each other on new certifications or even new MVPs of the group (Mar Lizana just became the 6th current MVP of the group! along with Alex Ayala, Diana Aguilera, Iván Arribas, Ricardo Rincón and myself )

Coming back to the stickers… I have shared the super-short run of stickers I ordered at Stickermule with fellow organizers and I want to share similar stickers with those that come to speak at PUG Barcelona and ultimately, ALL members of PUG Barcelona

All these thoughts though go along with another thought… How am I going to pay for them? The super short run is one thing, but like my wallet, it does not scale. So when stickermule offered a nice amount of credit for a blog post with a link I thought it was an offer too good to pass. (Besides the link, the content of the blog post is completely free)

I did three-inch stickers and they look awesome but are a bit big for today’s laptops, so I think I’ll use the credit to create a bunch of two-inch stickers and give them out at PUG BARCELONA events.

If you want to speak at PUG Barcelona (either in-person or online) let me know! We’ll try to make it work, and if we do, you’ll get a sticker! Think about it!

And if you rather create your own stickers, follow this beautiful link!

–>> custom stickers <<–

Be good and take care!
Hello!

The other day on the PUG Barcelona whatsapp group there was a question regarding the possibility of reversing the selection on a slicer, with a single click. Apparently this is something you can do on Qlik and the fellow member was trying to migrate that to Power BI as the users are used to be able to do it. I thought that you can get somewhat close to that with a calculation group, so why not write a nice short article on it. Let’s do it!

Continue Reading..

This is a very recurring topic. You carefully build a dataset semantic model for each business process, and when it all looks good in your Power BI App, some top brass requests a top level summary with key visuals from pretty much all the different models. And they ask for it like for tomorrow. What is to be said? In this post I want to go over the different alternatives, each with pros and cons. Some with fewer pros than cons, but still. At the end I’ll present an alternative when the standard options don’t make the cut. Let’s get started.

Continue Reading..

Hello! Today we leave PowerApps aside, but we head into yet another area way out of my confort zone: Programmatic creation and refresh of custom M Partitions! this is not something I really wanted to do, but I found myself with no other option available. Are you ready? Let’s do it. Continue Reading..

Hello,

The other day I was watching a video from SQLBI and for the first time I had a surprising thought. I thought «Hey, I would not do it like this». In DAX as in other languages, there are some things that are just a matter of style, sometimes is more. Which case is this, is up to you. Today it’s not going to be super-long, I promise.

Continue Reading..

Hello hello, before the topic cools down, let’s complete what we started the other day. As a quick recap we built a Power Automate flow that will launch refreshes of Power BI datasets only when certain ETL jobs of the server have successfully completed. And not only that, those datasets that read from certain high-demand databases will be limited to a certain number of simultaneous refreshes. If you haven’t read it, go and do it. In this article I want to share how I built the PowerApp to manage the ‘Datasets table’ and the ‘Preceeding jobs table’ we discussed on Part 1 of this series. I’m no expert in PowerApps. What I’ll share is what I’ve learned very recently by googling, asking around and tons of trial and error. If there are better ways of doing it, please let me know! with this out of the way, let’s get started!

Continue Reading..


Hello hello, it’s been a while since my last post because, well because… stuff, you know.

Anyway, today I want to talk about a solution I put together at one of my customers in order to orchestrate refreshes, so that dataset refresh once the precedent ETL jobs have successfully completed (never before that) and at the same time do not overwhelm the server. I’m sure that there are a thousand other ways to do it, but I have not seen many articles on «Dataset refresh orchestration with Power Automate» so I thought that could help others facing the same struggle. In this first part I’ll focus on the Power Automate side of things and I’ll leave the Power App for the second part. Let’s start:

Continue Reading..

I know, it’s a terrible title, but it’s the best I could come up with. This blog post is to explain a workaround for a behavior I detected while playing with a field parameter (all measures) and a stacked column chart. The problem is as follows: If you have more than one measure in the chart, you can define a color for each measure and all works fine. However, if you filter your field parameter table in a way that only one measure is used in the chart, then that color is ignored and you get a default color. What’s even worse is that the same color will be used whenever a single measure is included, so you can’t even configure it again to get the right color. Fighting the same issue? Keep  reading!

Continue Reading..

Hello!

Today (well yesterday by the time I have finished writing this) saw a great use case of calculation groups and I wished I had come up with the idea myself because it’s awesome and something that I’ve come across sometimes. In a table there’s a breakdown by month, and at the total they want to see sum, but also want to add another column with say the average, but could be also the value last year or growth. Yes, I’m talking about the latest video from Chandeep Chabbra. The video is beautifully set up so it’s definitively worth a watch.

Even though there’s a few things I would change from the DAX of the format string expressions, that alone would not justify a blog post about the same use case. But yet I wanted to play with the calc group, so what I plan to do instead is to show you the process to «industrialize» this calculation group, i.e. how to create a script that will replicate similar logic whenever you want to use it. Yes, I mean a c# script. That’s something I’ve been doing lately in some sessions,  but it’s not yet in the blog so why not use this occasion for it.

Continue Reading..

Hello,

today I’m not writing any type of tutorial. I just want to share a weird behavior I have found in calculation groups, hoping that those that really know about the inner workings can help us comprehend why they behave like that. Calculation groups can be seen as groups of pairs of DAX expressions that replace measures and their format strings when they are in a filter context where they participate. There’s quite a few articles that explain calculation group precedence, but when a calculation item is applied, how are the values of SELECTEDMEASURE and SELECTEDMEASUREFORMATSTRING evaluated? are they the values and format string *before* anything is applied? What happens if we include SELECTEDMEASURE inside the format string expression or SELECTEDMEASUREFORMATSTRING inside the value expression? If your head is about to explode, you are not alone.

In the different posts of this blog I’ve reached different conclusions in different articles, so today I want to present two examples to deepen in this topic — during this process I hope to understand it more!

Continue Reading..

In Power BI there are plenty of features to allow people discover content, but I don’t think it’s really useful. For once, with the exception of promoted & certified datasets, you only find what you have access to, and in many places access is given on a one-by-one basis. You ask for it, you get it and and you go on with your life, but you don’t know what you don’t know, and that can be limiting. Sometimes information is not shared because no one has bothered to share it (maybe because they don’t have role-based security groups). What if we could show a list all the apps that are out there and you could search simultaneously  in app name, app description, report name and report description? The link to the app allows you to request access. Sounds good? Let’s get started!

Continue Reading..

Hi! actually I was writing another blog post, but today I was shown something that can be done with calc groups that I wasn’t aware of. And not only that, even though the blog post I was shown had some very clever thinking behind, I found there’s still some room for improvement to bring the technique to the next level. We are talking about sorting a matrix by a calculation item placed at the columns section. Let it be said that in many use cases you might be better of just generating the measures with a script (as I showed in this blog post) and using the measures instead. That will give you more control with the UI since each column is indeed a different measure. Yet, there’s something cool in doing things in different way, so I’ll go ahead nevertheless.

Continue Reading..

This blog post is 90% SQL server and 10% Power BI, so if you are not into SQL Server (or relational databases in general) this might not apply to you. That being said, this blog post explains how to record the size of all tables in the server, and how to measure which tables are being used without enabling query-logging which can bring your server to a halt (or at least so I’ve been told by the DBA).

Some context, in one of my clients they do have most of the data that they manage in a SQL server with ODS replications of operational databases and a data warehouse where all serious reporting should be based. In that sense they have things pretty much sorted out if we compare them with companies that still do critical reporting based on excel files on a SharePoint. Yet, even having a very expensive server we often run into problems and space is always a problem. So we figured to do something about it.

Continue Reading..

Hello hello, today is C# again. As you know I do like C# scripts for Tabular Editor, as they allow us to automate stuff around Editor, which in turn allow us to do things faster than in Power BI Desktop, so it’s like a super power on top of a super power. In my previous post on the topic, I talked about using a custom class to be able to reuse code, making your scripts, shorter to write, and more robust, as you can put all the bells and whistles once in you custom class and reuse forever. That approach is awesome, but it had still two remaining aspects preventing larger adoption. One is that the set up as a bit of a pain. And the other is that copying the code to tabular editor is not as fast as one would like. You need to select the code of the macro, then the custom class, then fix all the external references at the top, etc. Well, today I’ll talk about a repository that will allow you to start coding in almost no time, and a script that will copy any of the macros of your Visual Studio file *along with the custom class code* and even combining all the external references of both the macro and the custom class. How cool is that?!

Continue Reading..

Yep, today it’s reporting. Lately I’m trying to give some shape to the governance of an organization, and well, reports having a unified look it’s a good thing. At the very least for those supposed to be «Tier 1» or «The reports that really matter to top brass people». As with business logic, I’m all in when it’s about centralizing stuff in one place, and report themes are indeed this: a file that stores the default configuration for pretty much any setting of your visual objects, page and so on. However, Power BI Desktop does not really allow you to setup everything in the theme, and the alternatives were either editing a huge json file or using tools that were not quite up to the task until not long ago. This has changed and I’m completely addicted to the theme generator that Mike Carlo has put together in Powerbi.tips. IT’S AWESOME.

Continue Reading..

Hello hello, I’m not writing that much lately due to spring break and a DAX training I’m teaching, but I think I have just enough time to explain a fun use case I found the other day at work. In Real Estate each asset can be in a bunch of different states, especially if there is litigation, squatters, repairs etc. So in this case they want to compare the latest snapshot with the snapshot of one week ago, and see how many assets they have in each state, but also in which state were they a week ago. Let’s get to it!

Continue Reading..

Hello! Yes, this is the Esbrina blog, and yes, it’s an article about Power BI Governance! About time! After learning many things with Melissa Coates and Mike Carlo, and having now some experience as a Power BI Admin, it’s time to start writing about the strategy I’m trying to put in place, in case this is useful for other admins out there.
My client is not huge, but is not tiny either around 200 pro licenses and 900 staff plus providers. Crucially it’s spread across 2 different tenants, but both organizations fall under the same CEO and many teams are cross-tenant, so yes, it gets messy.

Continue Reading..

Hello there,  yes, a third part of the snapshot report and I’m not even sure it’s the last one. The thing is that since the last post there has been some major improvements on the set up that I thought are worth sharing. In my previous post I ended up with a small defeat. There were some combinations of filters that when I drilled through to see all the historic records of those order IDs I would not get any rows. Also my set up included duplicating the fact table which is a big no-no in most use cases and a shameful solution from a modeler perspective. Even though this was the best I had, I decided to present the topic on two events, one was the Data Community Day Austria 2023 and the other was @PowerBIEspanol Virtual Conf 2023 (Fin Tour Power BI Days), just a few days apart. The fact that I had to present the solution to a lot of people kept me thinking and looking for solutions, so with the help of the always reliable Ricardo Rincón I finally found out a working solution just duplicating dimension tables and creating dimension tables for everything (even comments and stuff like that). That was much better but not quite scalable. In real life things are ugly and tables have many columns. So while fighting with the same use case at work, I found a sneakier and much better solution that got rid of all those superfluous dimension tables reducing the need of them to just 2. While preparing the presentations I also worked a bit on the report layer and I’ll also share some techniques I came up with that can be helpful at some point. But enough of all this talking, let’s do what? Let’s get to it.

Continue Reading..

Well, I was happy with the result, but I was even more happy with the reaction on twitter. The dynamic header effect felt like magical to many people, and well, I have many more followers now, thank you all.

In case you haven’t seen it, here’s the video

So how did I do it? Short answer: Field parameters. A little longer answer: Measures and a calculation group create more measures that are put in field parameter with some customization.

Even longer answer? Let’s do it.

Continue Reading..

Hello again. You didn’t think there would be a second part, right? well, me neither. But as things turn out, I had to work on another report dealing with snapshots, and this time they wanted something fancier. It took me a while to figure it out, but I like the result so I thought it would be nice to share. In the first part, we just showed what went up and what went down, being able to go back and check any snapshot. However, in many use cases that does not tell the whole story. To explain why something went up or down, you need to show what went in, what went out (sometimes important to tell which way it went) and maybe even if the value changed between snapshots. If we just compare 2 consecutive snapshots is not that hard, but things get trickier we take longer time spans and we want to account for everything that happened in between.

Continue Reading..

Lately I’ve been building a report, which had not happened for a while, and I enjoyed the process. The final result too is simple yet effective, so I thought I would share the approach here because, yes, there is a calc group in place that does some of the magic.

This approach is valid when you want to follow the status of something, warehouse inventory, accounts pending to be conciliated, parking occupation. In all these situations, you are likely to be more interested in the latest snapshot than the previous ones, but at the same time you might be interested in the trends that lead to the present picture, and maybe even go back to a previous shapshot to have a look, without too many clicks. As you can see we’ll need to be smart about the date filter. For some elements we want the last snapshot only for others all of them, and yet we want we want the charts to interact.

Continue Reading..

Well, hello again. If you just got started with Tabular Editor scrips and programming in general, maybe today’s topic might be a bit too much, but if you either familiar with other programming or already know your way in c# scripts, then this will certainly become a valuable thing: in-script classes! I know it sounds scary and not something that you need, but if you want write awesome code and make your coding life better in general, they you need to pay attention: In-Script classes for Tabular Editor C# Scripts are a thing.

Continue Reading..

Well, well, this is another article about C# Scripts. A topic that deserves much more attention than it’s getting. If you haven’t read my previous post, go do it right now because otherwise writing a c# script is a very frustrating experience. Not as much as building a Data Factory pipeline as a newbie, but almost.

If you have already programmed in other languages, many of this will be obvious, but anyway, is good to see how this applies to C# scripting for Tabular Editor. In this article we’ll talk about checking what is selected, checking what is in the model, interactions with the user and avoiding some of these interactions. Let’s get started!

Continue Reading..

A few months back I wrote an article of what I thought would change the way I (and many more I thought) would write c# scripts from now on. In that article I explored the possiblity of creating a custom dll with all the classes and methods that would make my scripts shorter, more robust and more sophisticated all at once. The idea was cool but not quite convenient nor for development nor for distribution. However something good that came out of that is that my colleague showed me it was possible to have really good intellisense for Tabular Editor C# scripts inside Visual Studio! So even if you are not thinking about custom classes, you should definately be thinking on Visual Studio as your home for actual coding. Today I want to talk only on how to set it up so that it will not let you do anything that Tabular Editor 2 will not accept.

Continue Reading..

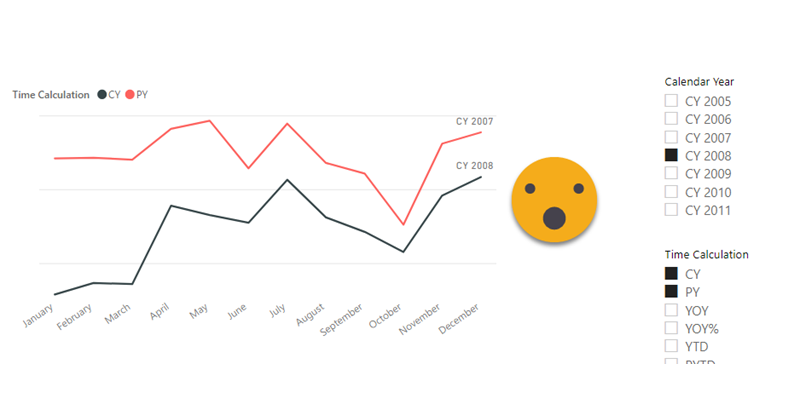
Well it’s no secret that I like calc groups. But it’s also true that calc groups have an achiles heel. Calc Item names are constant, so for charts, legends stay the same no matter what. Depending on your use case you might get away with it, but sometimes you might get an end user that will not buy it — and he or she might be an important person, so it’s always good to have a Plan B. Field Parameters have brought fresh air, and indeed are great for such use cases because it’s not like you modify the DAX of the measure in the chart, you actually change the measure, so the name shown in the legend also changes, which is great. However, what happens if you want to create a chart where the user can pick from 4 KPI’s and say 8 time intel calculations?? First you’ll have to create the measures, then the field parameter, then figure out how to model that for the user to be able to select measure and calculation intependently… I mean it’s not impossible, but looks long and boring. Let’s see what we can do about it!

Continue Reading..

Hi, today I want to talk about inactive relationships. Those relationships with the dashed line that unless you invoque them with USERELATIONSHIP they do nothing. The thing is a common pattern if you read this blog — let’s say you have a retail model, and for some charts you need to use the order date and in other charts the delivery date. Other than that measures are the same, such as Sales amount,  total cost, margin etc. Well, you could do a copy of each of the measures and wrap it in a CALCULATE( … USERELATIONSHIP(… ) ) or do a calculation group.  Today we’ll do that, with style.

Continue Reading..

So today I recevied a question on the SML group which looked like the perfect use case for a calculation group. Somebody was trying to build a matrix and wanted to have the values without decimals but the totals with decimals. In other words the goal was defining different formats for values and totals. Without calculation groups, the only way you can get close to that is by using the function FORMAT, but that’s a dirty trick that will come back and get you because now your values are text. If you later use that measure in a SUMX expression for instance, it will not recognize it’s a number anymore. Of course you could keep a measure for the value and a different measure for the formatted value, but hmmm then you would have to do that for all measures that you might want to use this way and well, you would have to manage this sprawling number of measures.  Let’s check both ways in case someone has external tools blocked or something.

Continue Reading..

As soon as I learned how to define transparency in HEX encoding for Power BI, I started thinking on how to control it with a calculation group. After all, you can only define transparency through a color measure, so it made sense. If you have seen any of my most recent presentations on Calculation Groups you might have seen a use case in which I show it’s possible to control the transparency (and light level!) of a color measure with calculation groups. However in such presentations I also say that I’m still looking for a decent use case to put them into practice. Today I’m attempting to do just that with the transparency calculation group.

Continue Reading..

I realize that I use the word «arbitrary» a lot on my blog posts, but then I think, «so what?». Anyway, this blog post is mostly a remake on another blog post, the one called «A truly dynamic tooltip«. When I wrote that blog post, I had struggled a lot to get the effect I wanted, but even though I learned a lot in the process I ended up convinced that it was better to stay out of calculation groups when building such a chart. Well, this is no more. Calculation groups, are ususal, are just fine. You just need to know how to use them.

Continue Reading..

I thought I would let the blog rest for a few days, but I figured out I would write a short one on a topic that Rick brouhgt up on LinkedIn: Controlling Calculation Items with RLS. I lived under the impression that being a table you could just apply RLS like in any other table, but he told me that Power BI throws and error when you try, and sure enough I got the same result. Tried cheating by creating a calculated column in the Calculation group, but the same result. But then I remembered the technique I used on my article on arbitrary two row header tables, and I gave it a try. It does work, so if you’re interested, keep reading. Continue Reading..

I know, I’m back again at validations, but this time is a bit different. Recently I’ve found myselft in a project where the data that was coming in was not fulfilling the sepcified requirements. We tend to thing that data that comes out of a system will always be pristine, but well, at least in one instance it was not. There were some validations set in place in Access + VBA. But then, even if the access was set out to execute every day you have to go in, check the output, and each file had it’s own validation access. Well, not great. Since the patience was running thin (errors kept apprearing in different places) it was decided that a full validatino check was to be set out. Or at least something much deeper than we had now. I figured out that we might be able to build something in Power BI. Data Validation with Power BI. Odd? yes, but hey, you gotta do what you gotta do.

Continue Reading..

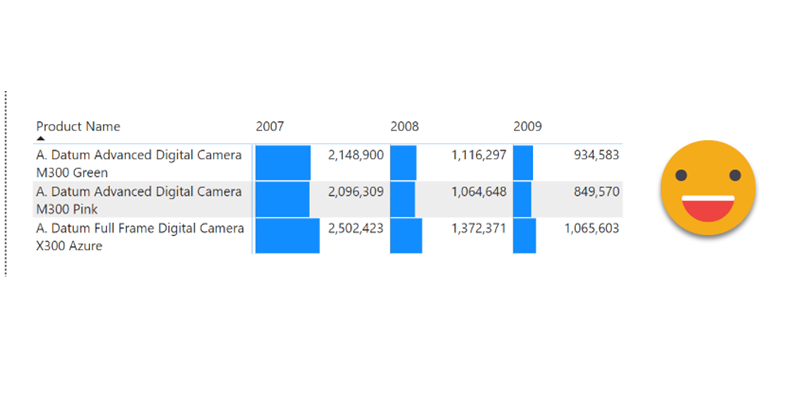
Ok, this is one of those things that I might not do in production unless I have the CEO shouting on my ear «I want the bars of the matrix to be smaller so I can read the numbers, and no, you may not use a custom visual for that!». I know that might be quite a narrow use case, but hey, if the CEO wants it, so be it.

Continue Reading..

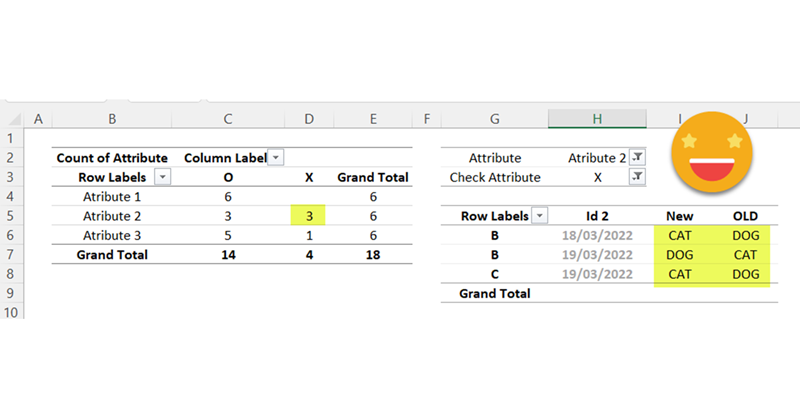
No calculation groups today. I decided I would document something that I’ve found myself doing quite a lot recently and I guess that other people might experience the same. Migrations. That’s what happens when somebody decides that SAP Business Objects needs to die and be replaced by Power  BI. Or that a the tables generated by processes orchestrated by Windows scheduler runing batch files that open access files with an autoexec macros that in turn execute a mixture of internal operations but some on a SQL Server stored procedures should at least be moved to a proper SSIS package (totally making it up, right?). All these things. At the end of the day you need to be sure that whatever was generated with the old way of doing things, gets created in the new way too. This is something that not much effort is devoted to do, but with some techniques you can have a tool that will speed things a lot. Continue Reading..

Calculation Groups biggest contribution is to help us reduce the number of measures that we have to create and manage. However, sometimes, me might want measures again… Of course we can forgo the calc group altogether, but we might want to keep the centralized logic while having actual measures, and not measures + a filter as we usually do with calculation groups. The most relevant use case that comes to mind is when we do not want our calculation items to travel to the tooltip or drill through pages, as I discussed in this post not long ago. I guess that for most use cases, creating the measures manually is not the end of the world, but hey, scripting is fun and is cool, so let’s automate that a bit.

Continue Reading..

It’s a terrible title, but by the end I hope it makes sense

Today I had some spare time and I thought I would do some c# that is always good to keep your mind going.  The goal was to create a script that given a base measure, you can then specify a column and a new measure will be generated for each diferent value of the column, in a pattern like CALCULATE([Base Measure], tbl[Column] = Value1 ) and the same for value2, 3 etc of that same column.

Continue Reading..

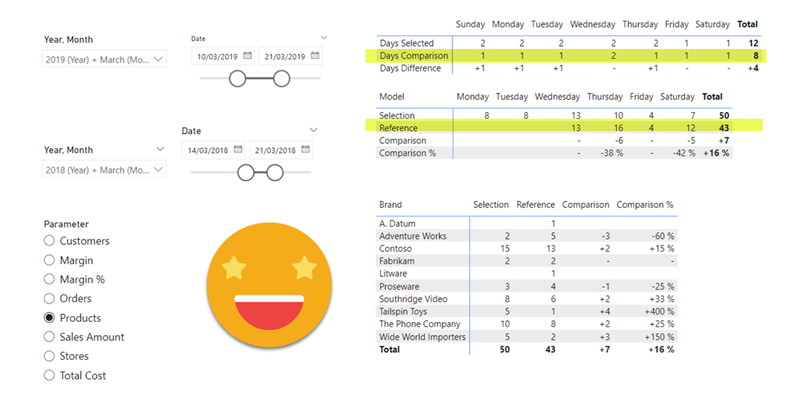
I’m always keep an eye open for potential new members of the Barcelona Power BI User Group. When I see a potential candidate I try to connect and get to know him/her. Today I was surprised that one of these unsuspected new members told me he was already using my script for Time Intelligence (yay!) and followed with a question on calc groups (double yay!). He was trying to build a KPI card which used a measure as the main KPI and wanted to use the previous year value as target, and was struggling to apply the calculation group just to the target one. I gave it some thought and I think the final set up might be useful to more people, so here I come.

Continue Reading..

Hello there, this is not an entirely new technique, but then again, maybe the use case will be useful to someone, so I’ll go ahead and put it here. Indeed the idea came once again from the whatsapp group of Power BI User Group Barcelona, great people all around. Paul shared with the rest of us a solution he brought to a question in the Power BI Community Forum. I that thread (and answering the particular use case) a few solutions involved doing it all in Power Query, while Paul brought in a DAX approach to the solution. Beyond the particular use case of the question, this raises the question: how can we show individual measures in a tabular format? Continue Reading..

Hello there, quite a while ago I wrote a blog post explaining how to override calculation items in tooltip. Basically, if I’m using calc item A and B in a chart, how can I use A B C and D in the tooltip. My solution was to add 2 extra calculation groups with lower precedence, one to remove filters from the calculation group on the main visual, an the other one (copy of the original calculation group) to recreate the desired calculations. This solution does work, but is quite tedious to maintain if you have changes in the original calc group, and (I’m not sure if it’s related) when combined with the time intel dynamic label calc group, it took A LOT to display the tooltip. I tested again a few days ago and even with my new laptop (i7 32GB of ram) it took like 10s, most of them going to «other» things, not the dax query,  so little can be done.

Continue Reading..

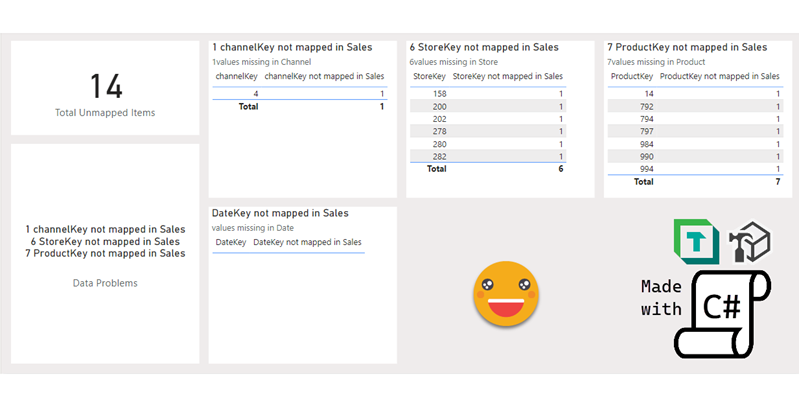
Referential what? it sounds weird, but it’s a rather basic thing: It’s like asking, do you have all the product IDs of the sales table in your product table? If you don’t, then is when that infamous «blank» appears in slicers and all kind of bad things start to happen. Unless you load everything from a pristine data warehouse, you should actively check these things, like after each refresh. It’s one of these things that you should do, but normally does not make it anywhere close to the top unless results look way off. If there was an easy way to check that…

Continue Reading..

Hello, hello. After another round of presentations that dried my spare time to blog, just today a new use case came to me through a question in the whatsapp group of the Power BI User Group Barcelona. The goal was to be able to select the measures that should be displayed simultaneously on the same chart. The key here is the plural thing. Otherwise just use the famous script to create a dynamic measure calc group from Johnny Winter and off you go. But here the need is to select the measures from a simple slicer. I want to se measure A, B and D but not C.

Continue Reading..

Hello there, today I don’t have any new fancy use case for calculation groups or anything else, but rather a repository of links to the best of the best c# scripts… to create calculation groups. The main use of this post is to point people this way when I do a presentation on calculation groups, for example. Since they are «one-click» means you can just store it as Macro/Quick Action and even put it in a custom toolbar if you are using Tabular Editor 3 (which you should!). I’ll just start with two, but I plan adding more over time.

Continue Reading..

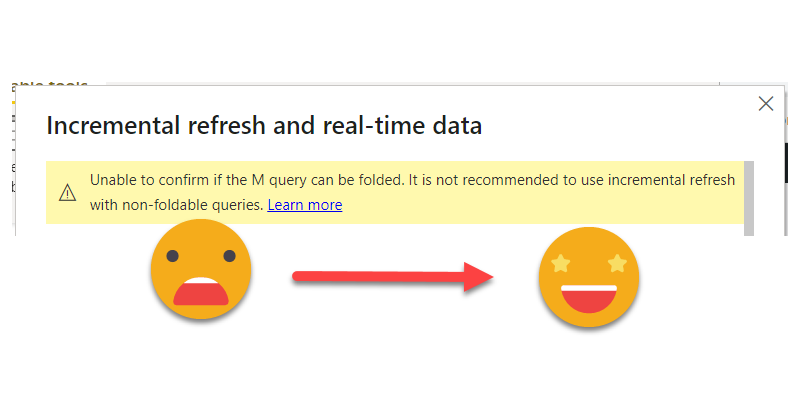
Ok, so today there are no calculation groups in place, but I want to explain a technique to use incremental refresh even when your source does not support query folding as we normally understand it. Let me explain myself: In general the only use case that is widely documented for incremental refresh is when you load from a relational database that has a static date column (such as creation date of the record). You create your RangeStart and RangeEnd datetime parameters and off you go. And if you only read from your beautiful DWH, lucky you, no need to read further.

In the real world (at least the one that I know) people want to retrieve data from SAP, like a lot. I don’t really understand this SAP thing, but basically they keep scrolling adding columns with weird icons next to it until it’s all in. However, if they try to retrieve too much info, the query fails. So what is to be done?

Continue Reading..

Once again I’ll recreate here a use case I found at work because I think it’s cool and with some gotcha’s that can be fixed.

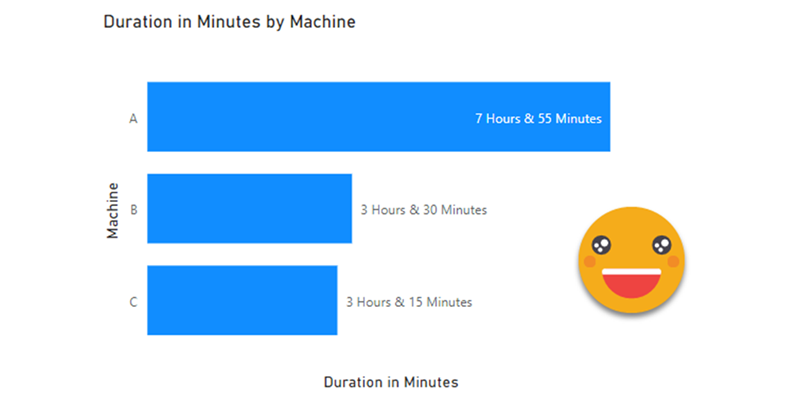
The use case itself is broad enough. We are measuring the duration of an event (working hours, machine runs, etc) and we want to visualize it. Since we want to compare things, we need to graph a number, however, as humans, we might like to see 4h 30min instead of 270 min. Searching around in google you will find several approaches for transforming a number of minutes or seconds into higher units of time. And that’s a great starting point. For example here’s a great post by Reza Rad. Here we’ll just imagine we have minutes and we want hours and minutes.

Continue Reading..

Is no secret that if you work daily with Power BI, you should be using Tabular Editor,  but if you are working with lots of different datasets you probably feel like you are doing the same thing over and over again. Then it’s time to bit the bullet and get your hands dirty with Tabular Editor scripts. If you do, don’t start with a blank sheet. Always copy from someone and build from there (that’s what I did!) — there are lots of great scripts out there. Maybe not tons, but certainly lots.

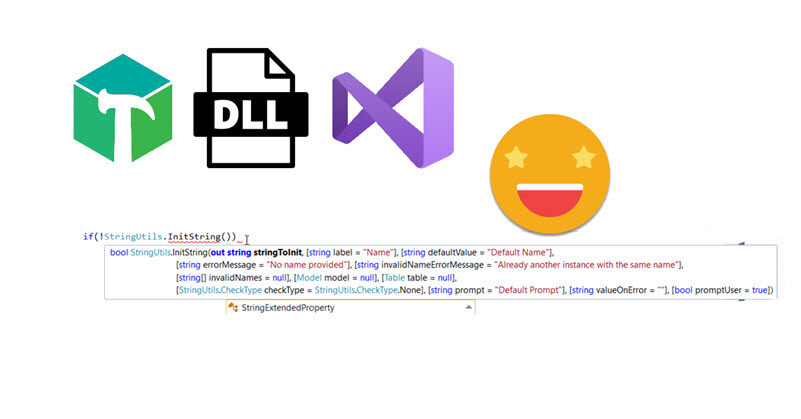
But anyway, once you get going with Tabular Editor C# scripts (now we need to specify if we are talking c# or DAX scripts) you may feel that you are repeating code, and as in any kind of programming, that’s not just a waste of time, it’s bad practice. So, today I’ll share how I’m starting to move my scripting to the next level, creating a custom DLL for Tabular Editor C# Scripts (never did that before!) and making use of intellisense by moving development (or at least the bulk of code typing) to Visual studio.

Continue Reading..

I’ve been meaning to write this post for quite a few weeks if not months, and looks like today I may start finally to do it. The detonator has been that I had to do it at work, and Yuki asked about it on twitter. Too much of a coincidence to let it go.

Conditional formatting when calc groups are involved is a bit more challenging, but as usual with calc groups, once you grasp how they work you can do almost anything you want with it.

Continue Reading..

After a long break due to a truckload of presentations (for my standards) here I’m back again with the blog.

I have a pile of ideas, but always the latest idea takes priority as it is hot, it’s burning in my head.

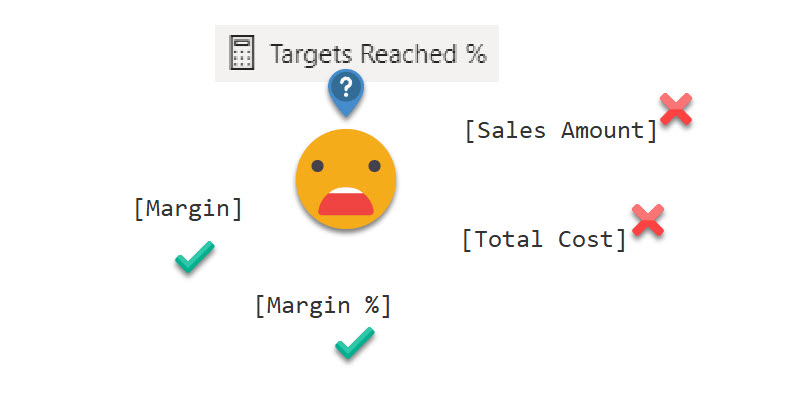
A guy from the Barcelona Power BI User Group asked me if calc groups could help him in a measure he was running. It’s like a measure of measures. There are several measures that represent different organizational KPIs, and they have a disconnected table in which there’s a target for each measure. He wants to know the percentage of targets that were met.

Continue Reading..

It’s a loooong title (well, it was «Conditional Formatting with divergent color gradient for values and totals»), but it’s exactly what I wanted to achieve when I discovered the limitations of the conditional formatting options in the GUI of Power BI Desktop. The key words are «dynamic» in one hand and «values and totals in the other» I know, some of you may think I’ll be doing some copy-cat article of the crazy video from Bas in which he shows how to use the undocumented (that I know of) function hsla(). A function that you need to leave as text?!? Crazy, just crazy. But no, I take a complete different approach and I think it’s worth the effort! Of course you can take ideas from both me and Bas and come up with your own unique approach for dynamic conditional formatting.

Continue Reading..

If you have worked with Matrix visual you probably have faced the problem: Your end user would like to group all the measures that are thrown in into neat little groups, putting all de Quantity- related measures in one group, all the value measures in another, for example. What I’ve seen so far is that people just struggle with the fact that this is not possible in the Matrix visual, and add text boxes on top, as if the header was indeed a two-row header. But it’s not. And if you have a large matrix that requires horizontal scroll, you’ll know what I am talking about. Can we do any better? Yes. Are calculation groups involved? You bet. Difficult DAX? Not at all!

Continue Reading..

Today’s topic is more like an academic exercise than a production use case, but there are a lot of learnings along the way and I think it’s worth the effort.

The other day I saw a tweet by Igor Cotruta that talked about «text fingerprinting». The idea is embedding the user id in invisible characters so that if the exported data get’s eventually leaked it can be traced back  to whoever exported it. Looks like stuff from a spy movie, so I was quickly on-board in the attempt to reproduce that with Power BI with a Calc Group.

Continue Reading..

Ok, I have maybe gone a bit overboard with the title, but I think it has some advantages over other hacks out there to establish the column widths of matrix, so here I am to explain how I came up with it and how to use it.

The first hack I saw was from Ben Ferris (aka The Power BI Guy) which added a dummy measure with a number of 0 to make the width (having automatic width enabled) and then it would disable automatic widths and remove the measure. Nice. But of course, if new columns appear you’ll  need to set the thing again. Something similar happens with the approach of Bas, who skips the dummy measure thing and instead just plays with the format string to show the evenly wide number. His approach is cooler because you skip the measure thing, but you have the same weak points.

However, Bas’s video got me thinking on the topic and the role of format strings…

Continue Reading..

Ok, it’s a long title, but it’s the best I came up with.

So here’s the story. At work there was a sales report with a nice matrix. On the rows, we had several product attributes like category, subcategory and so on. On the columns it was a bit weird because they wanted to show the day of sale, but also compare with the day of sale from the previous year, and with some particular logic for  comparison: if current year had equal or more days of sale than the previous one, it should match day one with day one and so on. However, if previous year had more days of sale, it should match starting from the back, so day one of sale would be matched with day 2 or 3 of previous year. Anyway, this is just to say that I put a measure saying what was the actual day of sale for current year, and previous year, as well as the actual date, because sales are different depending on the day of the week. Then we had cumulative sales, daily sales, for current and previous year. So far so good. Oh I forgot. On top of that there was like % over forecast measure that was the source of all ills.

Continue Reading..

This may seem trivial, but it did not pop up in my head at first, so might be useful to somebody else.

In sales reports, there are lots of numbers. And if it’s a large company these numbers may be very large. So depending on the visual, the full number may be a bit too much, and having just thousands or millions is more than enough.

Continue Reading..

Hi there. In my previous post on how to set up a «data problems» button I did mention that there was a further improvement to the approach, so here I am to explain what is this about.

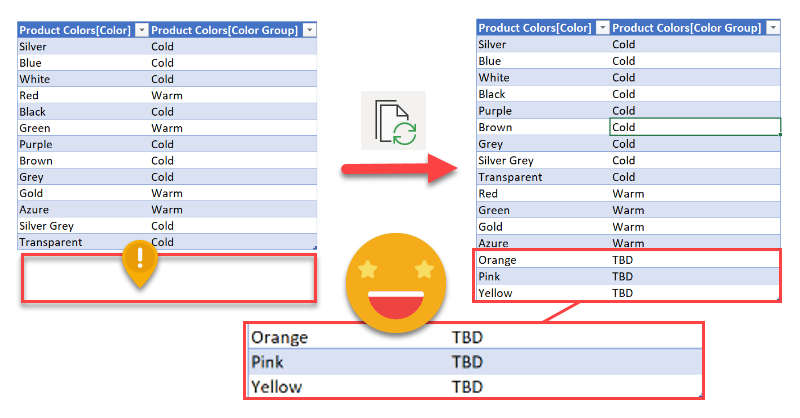
As you may recall, in my previous installment on the topic, the user is warned that there is some issue with the data through a button that brings him or her to a page where can see exactly what are the issues, such as unmapped items or any other data issues (dates which are not dates, numbers which are not numbers, duplicates…). Today will stick with the mapping problems. In such case you had to copy the offending items, add them to the excel table, and complete the (manually maintained) extended attribute columns.

Wouldn’t it be wonderful if those items could automatically travel to the excel file?

Well, this is exactly what we’ll try to get to in this post. We are going to do data mapping with table connected to the dataset

Continue Reading..

In this post I’ll explain how to break the tyranny of the «all filters» that are passed to the tooltip in particular the filters set by a calculation group which are even nastier to get rid of than regular filters.

It wasn’t intended this way, but this post is sort of a sequel (and not SQL) of my post on dynamic labels for time calculation series, which itself builds on the post introducing the time intelligence calculation group script. If you have not read them you can also watch the video you’ll find on the end of each post — although from the sound quality maybe it’s less painful to read the blog!

Anyway, if you are here probably you know something about calculation groups, and that’s good, because there’s plenty of them coming.

Continue Reading..

I’ve seen it many times. While there is a set of «official» attributes for a product, or a client or whatever, a department may choose to group them through one or more custom attributes. And what do they do? Of course, they create an excel file where they manually maintain a table with the key (hopefully) and all the custom columns. They will tell you that they update it whenever a new value appears in the datasource, but if you double check this statement you might get let’s say «mixed results» at best.

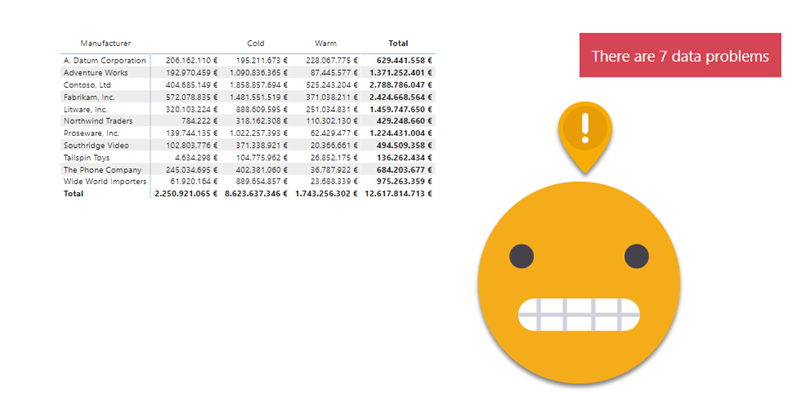
Nothing says «there is a problem» as a red button appearing in your report. And if it offers «actionable insight» on how to solve the problem, so much better. So this is what we’re going to do: A data problem button.

Continue Reading..

As I continue my journey with calculation groups I realize that fewer and fewer people may be interested in what I write, but then I think, «so what?» So here I am.

My script to create a Time Intelligence Calculation Group based on Daxpatterns.com definitions got a lot of attention (for my standards, anyway), so I kept on thinking if there’s anything that would go nice with it.

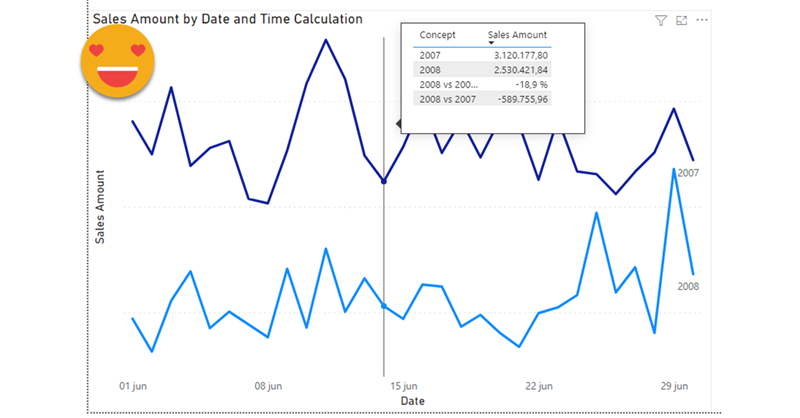
Indeed, in the latest iteration of the script, there are two measures that aim at providing some sort of dynamic labeling. «Label as Value Measure» is a measure that when in the scope of a Time Calculation of the calculation group, will show the appropriate label taking into account the filters on the date table. For instance, if you select YTD calculation item and year 2008, the measure will show «2008 YTD». And so on. (Label as Format String does the same but using the format string expression so it can be used as sort of dynamic axis labels if you want to place several calculations as the X-axis, but we’ll focus on «Label as Value Measure» which has more general applications)

Continue Reading..

Sometimes we face models which can’t be built because we fall into the circular relationship (which Power BI protects us against) or ambiguity (which sits there silently making all our results meaningless). I faced one of this situations the other day at work and found a workaround with –you guessed it– a calculation group.

Continue Reading..

This is one problem that you don’t realize it’s a problem until you face it.

Happened to me designing a P&L report. For this report, an arbitrary list of items (arbitrary to me of course) has to be displayed in certain order, each with it’s own arbitrary calculation, and even with some hierarchy indentation. Easier said than done, really.

Continue Reading..

This post is based in a true use case. The customer followed the market share trends, to see how it compared to the rest, as a manufacturer, and at a brand level.

So far so good. But coming from excel they were used to build charts any way they saw fit, so they liked to see on the same chart their own year-on-year growth in general as a manufacturer, then in different distribution channels, then specifically the growth of their two main brands, and then the growth on different regions. That alone was my first challenge. But then they said that that they would like to know how others were doing on the tooltip. But of course, when looking at a manufacturer-level value, they would like to see their value together with that for other manufacturers, and when looking at a brand level then wanted to see it with all  the other brands. I added to the mix that it would be nice to see highlighted their own value in the tooltip of course.

Continue Reading..

Ok, by now you probably know I’m a liiiiitle too much into calculation groups. Once you try calculation groups there’s no going back. Particularly if you do time intelligence analysis (that is comparing values with the previous year, but many other things as well). The reason is that normally you would create a new measure for each pair of calculation – measure, (e.g. Sales Amout PY, Sales Amount YTD,  Total Cost PY, Total Cost YTD … ). With calculation groups you just create the box that shifts a measure into producing the time calculation that you want.

Continue Reading..

Ok, this is a rather niche use case, but I’ll go ahead anyway, basically because I think it’s cool.

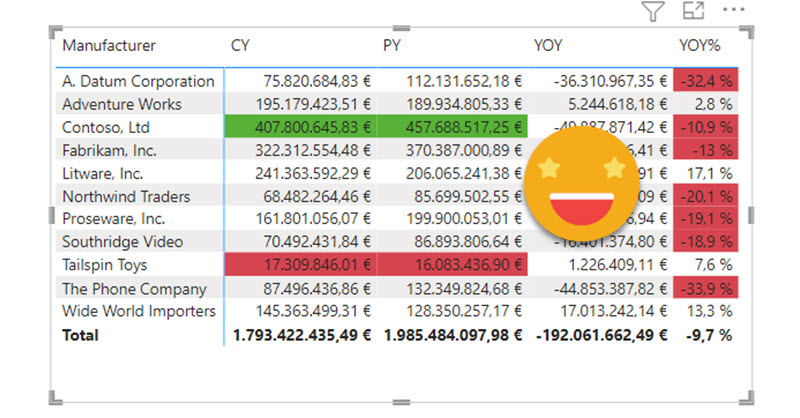
In conditional formatting in Power BI you have three options: By values, by rules and by measure.  In this last case, you have to provide a measure which provides a hexadecimal code, such as #FFFFFF for white and so on. When I saw this option I liked it because you can write the most twisted logic of the world and format according to that, but I felt uneasy about the fact that you have to hardcode the hexadecimal codes in the DAX logic. WHAT IF YOU DECIDE TO CHANGE THE THEME OF YOUR REPORT??

Continue Reading..

Calculated tables are not used often, because after all, it only combines data that you already have, right? Well, I didn’t use them often, until recently.

I was shown an excel chart displaying market share among top contenders, but including CY vs PY, then CYTD vs PYTD, then MAT vs MAT-1, and then the last 12 months as individual points. «This is what we would like to have»
Continue Reading..