Ok, by now you probably know I’m a liiiiitle too much into calculation groups. Once you try calculation groups there’s no going back. Particularly if you do time intelligence analysis (that is comparing values with the previous year, but many other things as well). The reason is that normally you would create a new measure for each pair of calculation – measure, (e.g. Sales Amout PY, Sales Amount YTD, Total Cost PY, Total Cost YTD … ). With calculation groups you just create the box that shifts a measure into producing the time calculation that you want.
So for instance, if you want to avoid creating a «PY» version of all your measures, you just create a calculation group and there you create a calculation group item that goes something like
PY =
CALCULATE ( SELECTEDMEASURE (), SAMEPERIODLASTYEAR ( Date[Date] ) )
However if you go like that you will bump into several pitfalls, like producing a last year value in the future, using current values, which we do not want. Lucky for us all, the guys at SQLBI have gone through all that and already com up with a pretty good solution for each of these calculations, and not only that, you can check them out for free at daxpatterns.com which is crazy. Some even have free videos.
The expressions at daxpatterns.com are thought in terms of measures, so you will need to do some tiny transformations. Any time you see they refer to [Sales Amount] that’s their example measure, so for a calculation item that’s going to be SELECTEDMEASURE().
Now, what happens when they refer to [Sales Amount PY] ? Fear not, as we can use other calculation items in our definitions using CALCULATE expressions.
For instance, this expression
Sales YOY % :=
DIVIDE ( [Sales YOY], [Sales PY] )
Assuming of course that YOY and PY calculation items are already in place, can be transformed into
Sales YOY % :=
DIVIDE (
    CALCULATE ( SELECTEDMEASURE (), 'Time Intelligence'[Time Calculation] = "YOY" ),
    CALCULATE ( SELECTEDMEASURE (), 'Time Intelligence'[Time Calculation] = "PY" )
)
(UPDATE (2-May-2021): This approach has dangers as pointed by Alex Dupler and Marco Russo in the twitter thread announcing this very same post. This has been addressed as explained below. )
Now, if it’s always the same — or almost the same (because there are of course some references to objects in the model such as the date table or the main fact table) wouldn’t it be nice if we could just create them automatically?
Well, for a certain (small) subgroup of them now you can!
Introducing the new tabular editor script to create a DaxPatterns-compliant calculation group along with the required measure and calculated column in the date table!
UPDATE (2-May-2021): With the comments from Alex and Marco I rewrote the code avoiding using calculation items of the same calculation group. Being a script I simply reused the definition strings, although in some occasions I reorganized the code to avoid calculating the exact same value twice, like in YOY% and YOYTD%. While I was at it I added a percentage format string for these two calc items and calculation item descriptions for all of them, which is always nice to have
Instructions:
- Open your model (if it wasn’t already!)
- External Tools –> Tabular Editor (if you don’t have it, download it from https://tabulareditor.com/ there’s even a portable version)

- Download the file from my github repository https://github.com/bernatagulloesbrina/time-intelligence
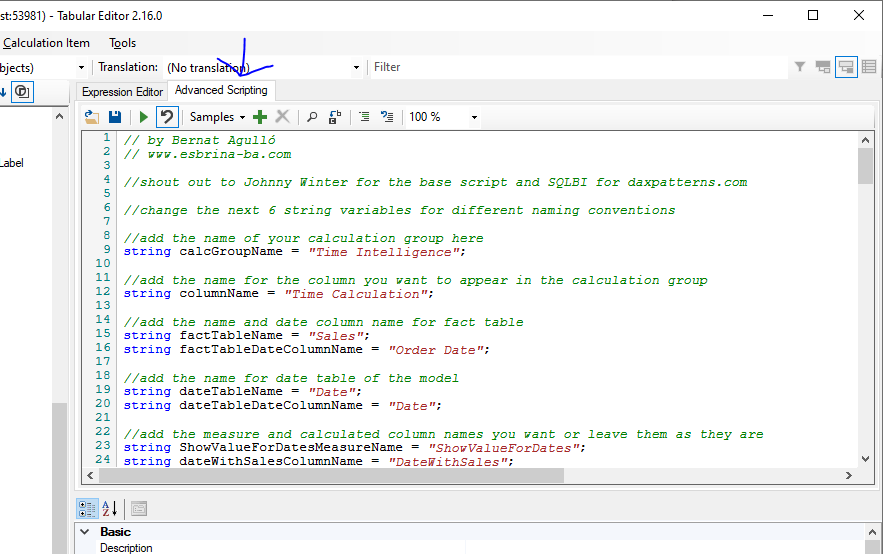
- Copy file contents and paste them into the Advanced scripting tab in Tabular Editor

Configure the initial parameters to match the fact table name, its date column, as well as your date table and its date column. Also define the names for the calculation group, its column and the auxiliary measure and calculated column required for the calculations to produce the desired results.-UPDATE! 27-Sep-2021 the new script will prompt you to introduce the parameters! no need to configure anything before running, and you can safely execute it as a custom-action or macro (depending on the TE version you are using)- (UPDATE! 2-May-2020 11PM) Select the measures* that you want to be affected by the calculation group.
If none are selected the calculation group will act on all measures under its filter contextThe latest version of the script forces you to select at least one measure.
* (UPDATE 3-May-2020) If your measures are in different tables, you cannot select them simultaneously in Tabular Editor. You can include their names in the configuration in preSelectedMeasures array variable. If there are also measures selected both will be included in the list of measures affected by the calculation group.Selection of multiple measures does work fine, and in any case you can create it with one measure and then add the names later in affected measures calculated table.
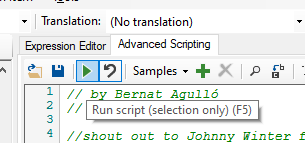
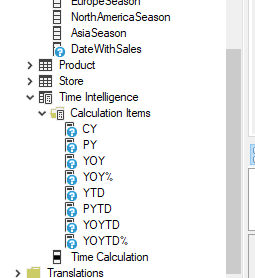
(UPDATE from some weeks ago) The latest version of the script creates a table where the names of all affected measures are stored so that if you need to change this configuration you can do it afterwards in a single centralized way. - Then click the green «play» button and the calculation group, the measure and calculated column will magically appear on the model inside tabular editor


- Save changes to see the group in Power BI, you might have to click a manual refresh button that will appear.


- Now you can use the «Time Calculation» column like any other filter column
If you want to play with it, I’ve placed two sample files here
- Contoso (Before Script) where you can try to follow the steps above
- Contoso (After Script) which is the result you should get after executing the script.
The before script already includes a (broken) visual which will use the calculation group of the script if you don’t change any default names.
I hope it’s useful to you. I did it because I think I’ll use it a lot. There are only a few calculation items included, but I think that it will not be difficult to add others if you so desire. I’ll probably update the script with the calculation items I need for the projects I face. If you want to participate feel free to do it.
So in this way, time calculations are only a few clicks away. Remember, as Patrick from guyInACube says, «I’m not lazy, I’m just really efficient»
Huge shout out to Johnny Winter from Greyskull Analytics for his script (if you haven’t seen it check it out!) and another one for Marco & Alberto from www.sqlbi.com for everything and daxpatterns.com in particular. Also thank you once again Kane Snyder for showing that you can use calculation groups in calculate expressions too, even if I had to get rid of that in the final version of this script!
UPDATE (2021-07-15): The script creates now a couple of measures that will ease your way into defining dynamic titles to show your user what PY actually refers to. Not only that, a companion calculation group (and even a script to create it) wait for you at «TIME INTELLIGENCE DYNAMIC LEGEND IN LINE CHARTS»
This post now also have a so-so video that explains how to use the script and continues with the dynamic labels script too. Check it out!
If you are reading this probably is because you saw this video from Patrick in GuyInACube. If you have not, then you should do it right now!
