Our Blog

I’ve seen it many times. While there is a set of «official» attributes for a product, or a client or whatever, a department may choose to group them through one or more custom attributes. And what do they do? Of course, they create an excel file where they manually maintain a table with the key (hopefully) and all the custom columns. They will tell you that they update it whenever a new value appears in the datasource, but if you double check this statement you might get let’s say «mixed results» at best.

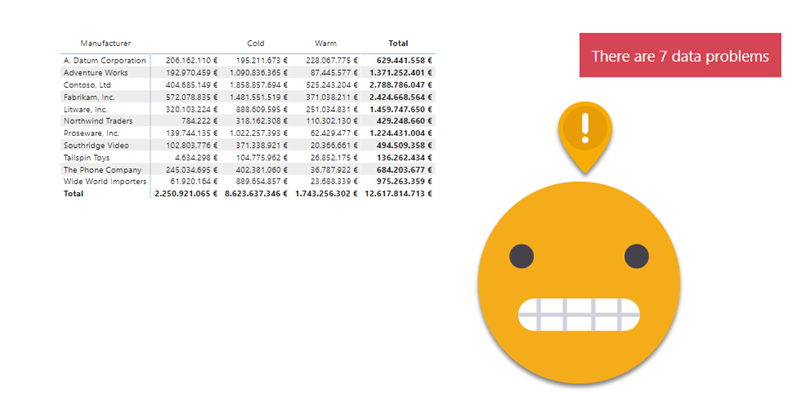
Nothing says «there is a problem» as a red button appearing in your report. And if it offers «actionable insight» on how to solve the problem, so much better. So this is what we’re going to do: A data problem button.

Continue Reading..

As I continue my journey with calculation groups I realize that fewer and fewer people may be interested in what I write, but then I think, «so what?» So here I am.

My script to create a Time Intelligence Calculation Group based on Daxpatterns.com definitions got a lot of attention (for my standards, anyway), so I kept on thinking if there’s anything that would go nice with it.

Indeed, in the latest iteration of the script, there are two measures that aim at providing some sort of dynamic labeling. «Label as Value Measure» is a measure that when in the scope of a Time Calculation of the calculation group, will show the appropriate label taking into account the filters on the date table. For instance, if you select YTD calculation item and year 2008, the measure will show «2008 YTD». And so on. (Label as Format String does the same but using the format string expression so it can be used as sort of dynamic axis labels if you want to place several calculations as the X-axis, but we’ll focus on «Label as Value Measure» which has more general applications)

Continue Reading..

Contacto

Contacta con nosotros y descubre el poder de la información.

Nombre
Email
Consulta

Ok! Mensaje enviado.
Error! Verifica los campos.
© Copyright 2022 - Esbrina