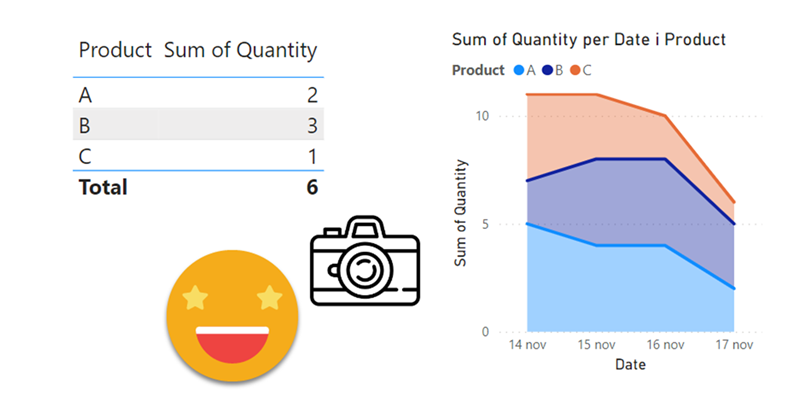
Lately I’ve been building a report, which had not happened for a while, and I enjoyed the process. The final result too is simple yet effective, so I thought I would share the approach here because, yes, there is a calc group in place that does some of the magic.
This approach is valid when you want to follow the status of something, warehouse inventory, accounts pending to be conciliated, parking occupation. In all these situations, you are likely to be more interested in the latest snapshot than the previous ones, but at the same time you might be interested in the trends that lead to the present picture, and maybe even go back to a previous shapshot to have a look, without too many clicks. As you can see we’ll need to be smart about the date filter. For some elements we want the last snapshot only for others all of them, and yet we want we want the charts to interact.

