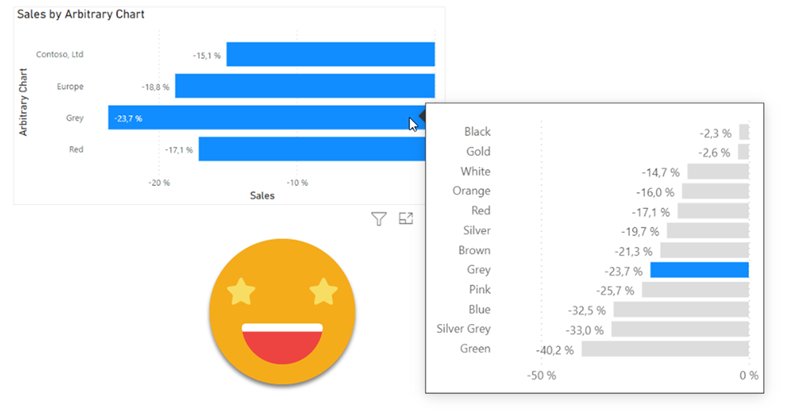
UPDATE: I was kindly asked by Kerry Kolosko to make a Work-Out-Wednesday challenge for this chart, and when I did, I realized that it’s much more simple than I laid out on this article. I keep as proof that finding the best approach is an iterative process! Building the model from scratch also helps. Check out the challenge (and explanation video) here!
Hello there! Time is crazy and I haven’t been updating the blog as much as I’d like to. But here I am and I hope you enjoy it.
This 2024 I took the decision to step up my involvement at Power BI User Group Barcelona and started organizing online events from international speakers. For those that present in English I even do some live interpretation that is recorded and remastered with the video stream so that we get the renowned presenters in both English and in a not-perfect Spanish translation (check out the events here and the recordings here). But why am I speaking about that? Well, first of all to brag about it because these sessions have been awesome, but also because the most recent one is the starting point for this blog post.