Referential what? it sounds weird, but it’s a rather basic thing: It’s like asking, do you have all the product IDs of the sales table in your product table? If you don’t, then is when that infamous «blank» appears in slicers and all kind of bad things start to happen. Unless you load everything from a pristine data warehouse, you should actively check these things, like after each refresh. It’s one of these things that you should do, but normally does not make it anywhere close to the top unless results look way off. If there was an easy way to check that…
Hi there. In my previous post on how to set up a «data problems» button I did mention that there was a further improvement to the approach, so here I am to explain what is this about.
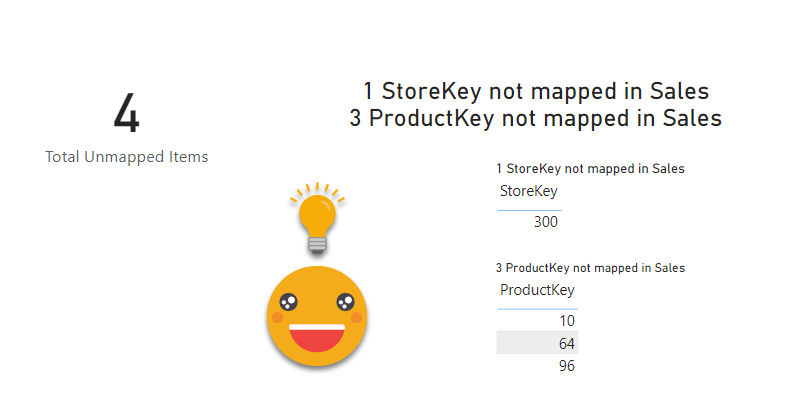
As you may recall, in my previous installment on the topic, the user is warned that there is some issue with the data through a button that brings him or her to a page where can see exactly what are the issues, such as unmapped items or any other data issues (dates which are not dates, numbers which are not numbers, duplicates…). Today will stick with the mapping problems. In such case you had to copy the offending items, add them to the excel table, and complete the (manually maintained) extended attribute columns.
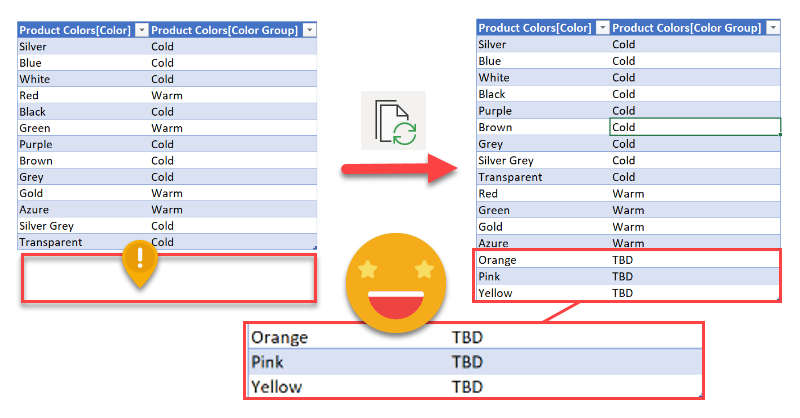
Wouldn’t it be wonderful if those items could automatically travel to the excel file?
Well, this is exactly what we’ll try to get to in this post. We are going to do data mapping with table connected to the dataset
I’ve seen it many times. While there is a set of «official» attributes for a product, or a client or whatever, a department may choose to group them through one or more custom attributes. And what do they do? Of course, they create an excel file where they manually maintain a table with the key (hopefully) and all the custom columns. They will tell you that they update it whenever a new value appears in the datasource, but if you double check this statement you might get let’s say «mixed results» at best.
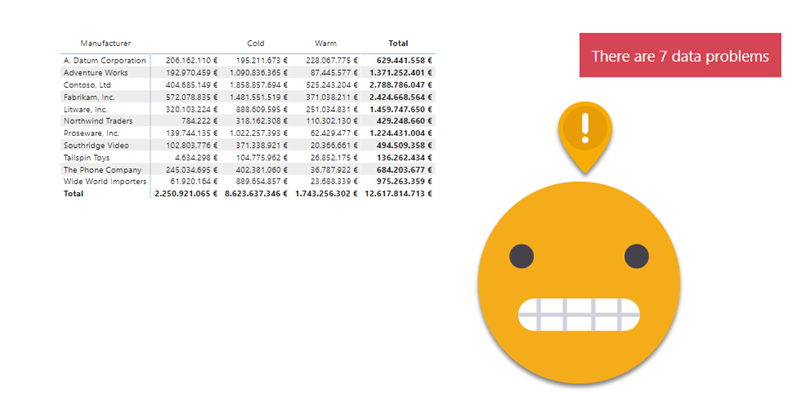
Nothing says «there is a problem» as a red button appearing in your report. And if it offers «actionable insight» on how to solve the problem, so much better. So this is what we’re going to do: A data problem button.