Easy Management of Referential Integrity

Referential what? it sounds weird, but it’s a rather basic thing: It’s like asking, do you have all the product IDs of the sales table in your product table? If you don’t, then is when that infamous «blank» appears in slicers and all kind of bad things start to happen. Unless you load everything from a pristine data warehouse, you should actively check these things, like after each refresh. It’s one of these things that you should do, but normally does not make it anywhere close to the top unless results look way off. If there was an easy way to check that…
No, this time it’s not a calculation group. But it’s a Tabular Editor script (that’s my other thing). The thing is that I would not have been able to write the script without this other article I wrote a couple months ago. And no, we are not using a custom dll this time, so the final script is good to go as is. The bit that help me write it is C# intellisense.
With Intellisense I saw I can iterate through the relationships of the model, and then check the relationship cardinality, and in case it’s one-to-many (or many-to-one) check for this referential integrity. Basically when I check the relationship of date with the fact I go like
ProductKey not mapped in Sales =
CALCULATE (
    SUMX ( VALUES ( 'Sales'[ProductKey] ), 1 ),
    'Product'[ProductKey] = BLANK ()
)
In a perfect model, all such measures should be blank. If they are not, then we have a –data– problem. While is at it, the script creates a second measure that concatenates the number with a text
ProductKey not mapped in Sales Title =
[ProductKey not mapped in Sales] & " ProductKey not mapped in Sales"
So we are counting the number of different ids that are found in the fact table but not in the dimension (and thus will cause «Blank» so show in filters). Each type of measures is created in a different display folder, all counters in «_Data Quality Measures» and titles in «_Data Quality Titles». Needless to say, all these should be hidden before going into production.
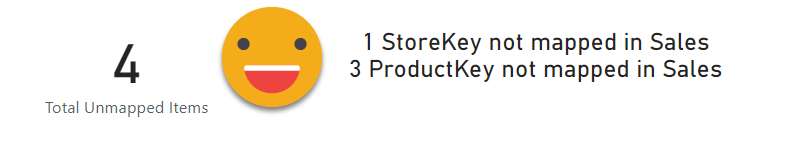
Actually there’s two more measures that are useful to summarize all the data problems detected. One is «Total Unmapped Items» which is just the sum of all the counter measures
Total Unmapped Items =
+ [StoreKey not mapped in Sales] + [ProductKey not mapped in Sales] + [DateKey not mapped in Sales]
This measure is useful to see if we have any problem or none at all.
But if we want to show a small summary of what the problems are one more measure will do the work: «Data Problems» follows this structure
Data Problems =
""
    & IF (
        [StoreKey not mapped in Sales] > 0,
        [StoreKey not mapped in Sales Title] & UNICHAR ( 10 )
    )
    & IF (
        [ProductKey not mapped in Sales] > 0,
        [ProductKey not mapped in Sales Title] & UNICHAR ( 10 )
    )
    & IF (
        [DateKey not mapped in Sales] > 0,
        [DateKey not mapped in Sales Title] & UNICHAR ( 10 )
    )
But let’s see how this plays out. First of all, my dataset comes from a relational database with phisical foreign keys so it’s *impossible* to have problems of referential integrity. So I added a few filters in the dimensions to cause some problems. Indeed, if we drag the «Total Unmapped Items» and «Data Problems» measures into KPI cards we already see what is going on.
Next we probably want to know which values are the culprits so we can go and fix the dimensions (especially if they are manually maintained, as it happens more often than people like to confess). We can go ahead and build the detail tables of the problematic relationships. The good thing is that if we ever get a problem in one of the other «safe» relationships, at least we’ll get the message and the total, and then we can proceed and go see why.
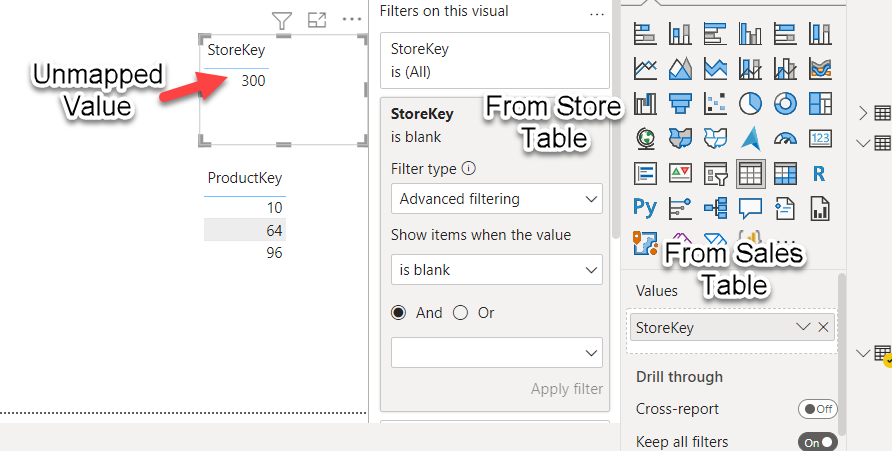
For now let’s build a table that shows the non-mapped values for StoreKey and ProductKey. We drag the Table visual into the canvas, and then we need to use the StoreKey field from the Sales table in the row section of the visual, and then we drag the StoreKey field from the Store table into the visual level filter. In advanced filtering we can select Is Blank. Or just select the blank value from basic filtering. And we do the same for ProductKey. And we already get a very decent result
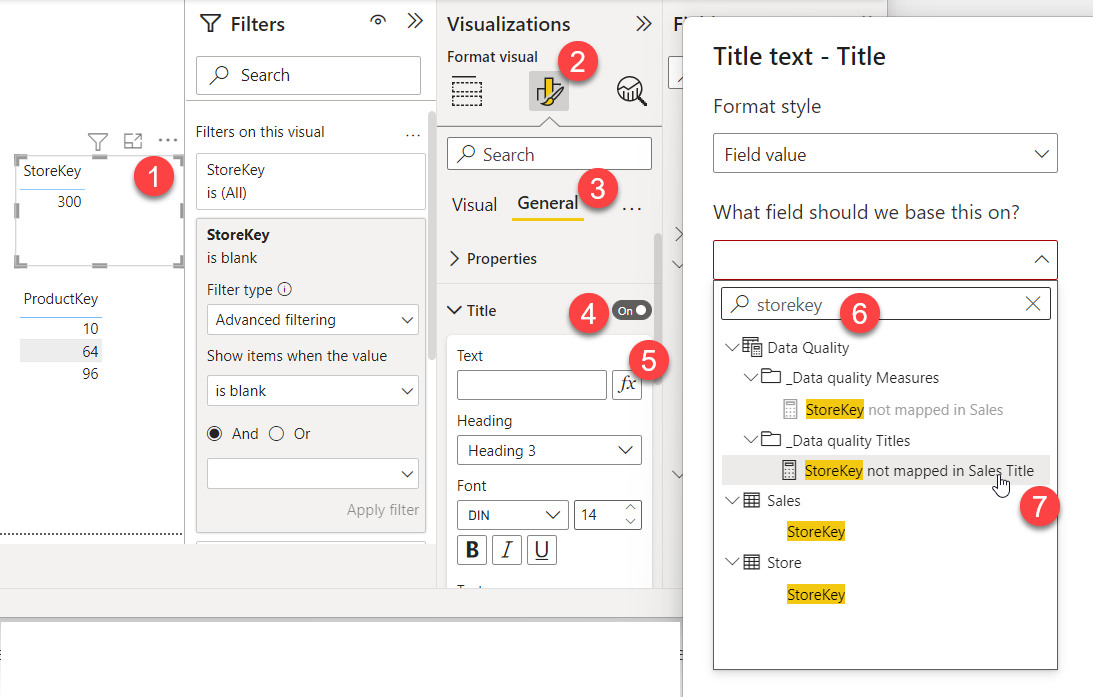
However, once you have a few tables like this on the same page, you loose track of what’s the meaning of each of them. Here we are just tracking referential integrity, but you could come up with other tables in which you captured duplicates in the dimension, or any other attribute you need to verify. So, how can we improve the readability of these tables? With a title of course. So, if you go back a few paragraphs you’ll see we have a bunch of measures which are called «ProductKey not mapped in Sales Title» and the like, And that’s what they are, titles, and not just regular titles, they are dynamic titles!
So for each table, we need to set up the title and choose the appropriate measure. It would be great if we could script the visual layer, wouldn’t it? Well we can’t. So go and find the measure, is not that tough. If you write the name of the field is difficult to go wrong.
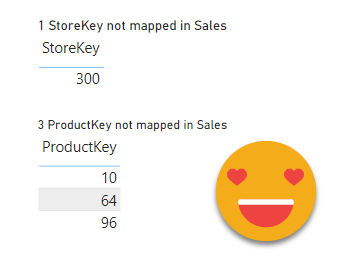
And the result helps understand the table
And this is not the end!
From this point you can continue with the steps I detailed in this other post, and create a button that will bring to this page if –and only if– there are any data problems that should be solved.
If you think «hey, that’s cool, I want that for me!» download the script and start rolling! To use it just select the table where you want all the measures created (I would create a dedicated measure table you can hide once all is set up), and click play. Since there is no set-up required, you can also store it as a table-level quick action/macro and launch it from right click menu or a macro toolbar if you prefer.
I just submitted the Pull Request so in a few days the script should show up also in the powerbi.tips repository
Thanks for reading, take care!
Feel free to post your comments on the Twitter or LinkedIn announcement