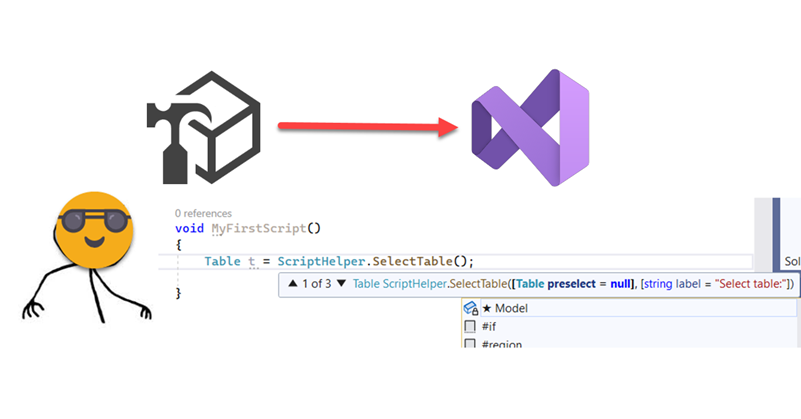
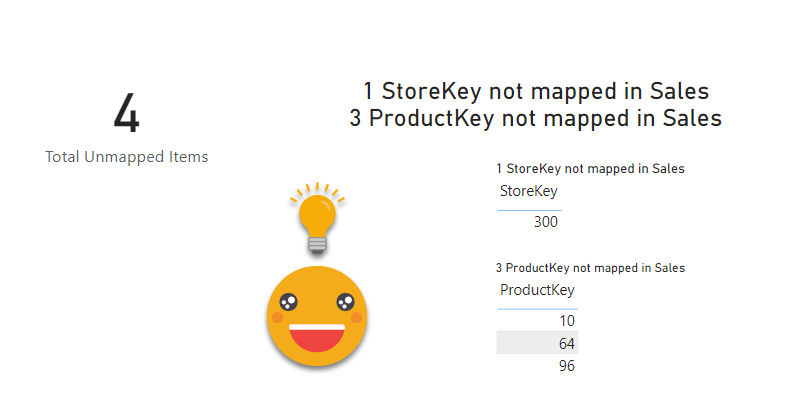
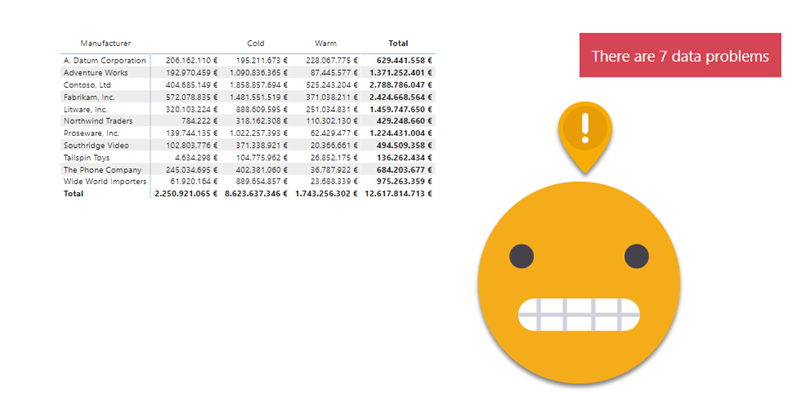
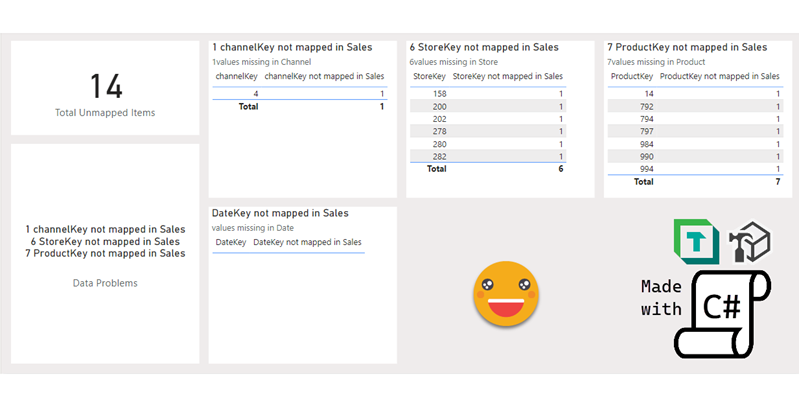
Tag: Tabular Editor

Hello! Today we leave PowerApps aside, but we head into yet another area way out of my confort zone: Programmatic creation and refresh of custom M Partitions! this is not something I really wanted to do, but I found myself with no other option available. Are you ready? Let’s do it. Continue Reading..

Hello!

Today (well yesterday by the time I have finished writing this) saw a great use case of calculation groups and I wished I had come up with the idea myself because it’s awesome and something that I’ve come across sometimes. In a table there’s a breakdown by month, and at the total they want to see sum, but also want to add another column with say the average, but could be also the value last year or growth. Yes, I’m talking about the latest video from Chandeep Chabbra. The video is beautifully set up so it’s definitively worth a watch.

Even though there’s a few things I would change from the DAX of the format string expressions, that alone would not justify a blog post about the same use case. But yet I wanted to play with the calc group, so what I plan to do instead is to show you the process to «industrialize» this calculation group, i.e. how to create a script that will replicate similar logic whenever you want to use it. Yes, I mean a c# script. That’s something I’ve been doing lately in some sessions,  but it’s not yet in the blog so why not use this occasion for it.

Continue Reading..

A few months back I wrote an article of what I thought would change the way I (and many more I thought) would write c# scripts from now on. In that article I explored the possiblity of creating a custom dll with all the classes and methods that would make my scripts shorter, more robust and more sophisticated all at once. The idea was cool but not quite convenient nor for development nor for distribution. However something good that came out of that is that my colleague showed me it was possible to have really good intellisense for Tabular Editor C# scripts inside Visual Studio! So even if you are not thinking about custom classes, you should definately be thinking on Visual Studio as your home for actual coding. Today I want to talk only on how to set it up so that it will not let you do anything that Tabular Editor 2 will not accept.

Continue Reading..

It’s a terrible title, but by the end I hope it makes sense

Today I had some spare time and I thought I would do some c# that is always good to keep your mind going.  The goal was to create a script that given a base measure, you can then specify a column and a new measure will be generated for each diferent value of the column, in a pattern like CALCULATE([Base Measure], tbl[Column] = Value1 ) and the same for value2, 3 etc of that same column.

Continue Reading..

Referential what? it sounds weird, but it’s a rather basic thing: It’s like asking, do you have all the product IDs of the sales table in your product table? If you don’t, then is when that infamous «blank» appears in slicers and all kind of bad things start to happen. Unless you load everything from a pristine data warehouse, you should actively check these things, like after each refresh. It’s one of these things that you should do, but normally does not make it anywhere close to the top unless results look way off. If there was an easy way to check that…

Continue Reading..

Hello there, today I don’t have any new fancy use case for calculation groups or anything else, but rather a repository of links to the best of the best c# scripts… to create calculation groups. The main use of this post is to point people this way when I do a presentation on calculation groups, for example. Since they are «one-click» means you can just store it as Macro/Quick Action and even put it in a custom toolbar if you are using Tabular Editor 3 (which you should!). I’ll just start with two, but I plan adding more over time.

Continue Reading..

Is no secret that if you work daily with Power BI, you should be using Tabular Editor,  but if you are working with lots of different datasets you probably feel like you are doing the same thing over and over again. Then it’s time to bit the bullet and get your hands dirty with Tabular Editor scripts. If you do, don’t start with a blank sheet. Always copy from someone and build from there (that’s what I did!) — there are lots of great scripts out there. Maybe not tons, but certainly lots.

But anyway, once you get going with Tabular Editor C# scripts (now we need to specify if we are talking c# or DAX scripts) you may feel that you are repeating code, and as in any kind of programming, that’s not just a waste of time, it’s bad practice. So, today I’ll share how I’m starting to move my scripting to the next level, creating a custom DLL for Tabular Editor C# Scripts (never did that before!) and making use of intellisense by moving development (or at least the bulk of code typing) to Visual studio.

Continue Reading..

I’ve seen it many times. While there is a set of «official» attributes for a product, or a client or whatever, a department may choose to group them through one or more custom attributes. And what do they do? Of course, they create an excel file where they manually maintain a table with the key (hopefully) and all the custom columns. They will tell you that they update it whenever a new value appears in the datasource, but if you double check this statement you might get let’s say «mixed results» at best.

Nothing says «there is a problem» as a red button appearing in your report. And if it offers «actionable insight» on how to solve the problem, so much better. So this is what we’re going to do: A data problem button.

Continue Reading..

This post is based in a true use case. The customer followed the market share trends, to see how it compared to the rest, as a manufacturer, and at a brand level.

So far so good. But coming from excel they were used to build charts any way they saw fit, so they liked to see on the same chart their own year-on-year growth in general as a manufacturer, then in different distribution channels, then specifically the growth of their two main brands, and then the growth on different regions. That alone was my first challenge. But then they said that that they would like to know how others were doing on the tooltip. But of course, when looking at a manufacturer-level value, they would like to see their value together with that for other manufacturers, and when looking at a brand level then wanted to see it with all  the other brands. I added to the mix that it would be nice to see highlighted their own value in the tooltip of course.

Continue Reading..

Ok, by now you probably know I’m a liiiiitle too much into calculation groups. Once you try calculation groups there’s no going back. Particularly if you do time intelligence analysis (that is comparing values with the previous year, but many other things as well). The reason is that normally you would create a new measure for each pair of calculation – measure, (e.g. Sales Amout PY, Sales Amount YTD,  Total Cost PY, Total Cost YTD … ). With calculation groups you just create the box that shifts a measure into producing the time calculation that you want.

Continue Reading..

Contacto

Contacta con nosotros y descubre el poder de la información.

Nombre
Email
Consulta

Ok! Mensaje enviado.
Error! Verifica los campos.
© Copyright 2022 - Esbrina