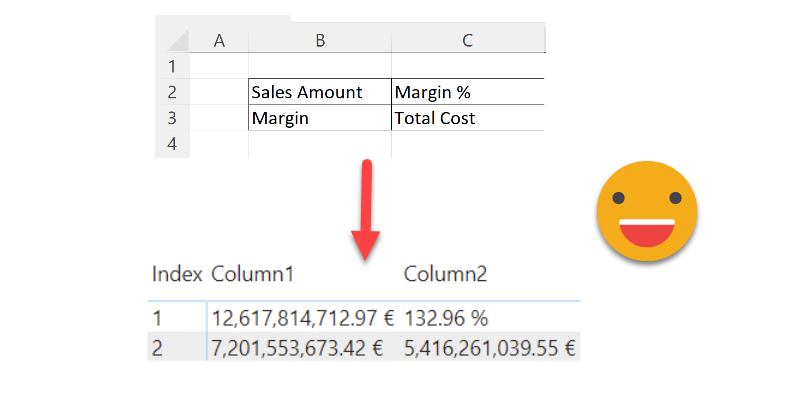
Hello there, this is not an entirely new technique, but then again, maybe the use case will be useful to someone, so I’ll go ahead and put it here. Indeed the idea came once again from the whatsapp group of Power BI User Group Barcelona, great people all around. Paul shared with the rest of us a solution he brought to a question in the Power BI Community Forum. I that thread (and answering the particular use case) a few solutions involved doing it all in Power Query, while Paul brought in a DAX approach to the solution. Beyond the particular use case of the question, this raises the question: how can we show individual measures in a tabular format? Continue Reading..
Our Blog
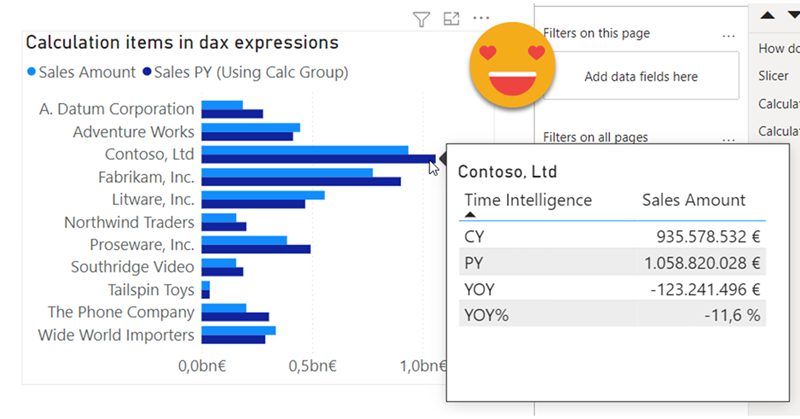
Hello there, quite a while ago I wrote a blog post explaining how to override calculation items in tooltip. Basically, if I’m using calc item A and B in a chart, how can I use A B C and D in the tooltip. My solution was to add 2 extra calculation groups with lower precedence, one to remove filters from the calculation group on the main visual, an the other one (copy of the original calculation group) to recreate the desired calculations. This solution does work, but is quite tedious to maintain if you have changes in the original calc group, and (I’m not sure if it’s related) when combined with the time intel dynamic label calc group, it took A LOT to display the tooltip. I tested again a few days ago and even with my new laptop (i7 32GB of ram) it took like 10s, most of them going to «other» things, not the dax query, so little can be done.