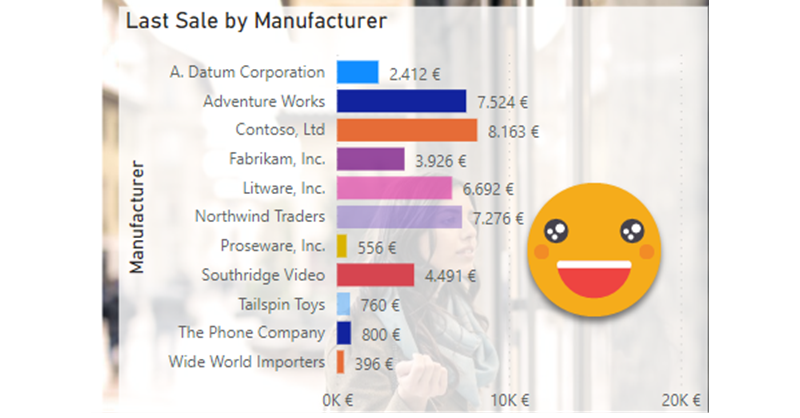
As soon as I learned how to define transparency in HEX encoding for Power BI, I started thinking on how to control it with a calculation group. After all, you can only define transparency through a color measure, so it made sense. If you have seen any of my most recent presentations on Calculation Groups you might have seen a use case in which I show it’s possible to control the transparency (and light level!) of a color measure with calculation groups. However in such presentations I also say that I’m still looking for a decent use case to put them into practice. Today I’m attempting to do just that with the transparency calculation group.
Tag: C# Scripts
CATEGORIES
- Esbrina (1)
- Fabric (1)
- Governance (6)
- Otros (1)
- Power BI (63)
- PowerApps (1)
- PowerAutomate (1)
- PowerShell (1)
TAGS
Circular Relationship
data quality
Apps
Reports
Powershell
swag
power query
PBIR
RLS
Data Validation
Dynamic Measure
Metadata
Dynamic SQL code
C# Scripts
Incremental Refresh
Custom dll
Hexadecimal encoding
Precedence
CSV
Binary
Zero-Width Chars
PowerQuery
hierarchy
Images
SQL Server
snapshot
security groups
Transparency
Power BI
REST API
Report
Time Intelligence
Governance
custom theme
Excel
Data Modeling
Chart
data mapping
Matrix
Visual Studio
Tooltip
conditional formatting
Field Parameters
Format String
Advanced Scripting
Tabular Editor
C# Script
DAX
Calculation Groups
ARCHIVES
- julio 2024 (2)
- mayo 2024 (2)
- abril 2024 (1)
- febrero 2024 (1)
- enero 2024 (1)
- diciembre 2023 (1)
- noviembre 2023 (2)
- octubre 2023 (1)
- julio 2023 (3)
- junio 2023 (2)
- mayo 2023 (2)
- abril 2023 (2)
- marzo 2023 (1)
- febrero 2023 (1)
- enero 2023 (1)
- diciembre 2022 (1)
- noviembre 2022 (2)
- octubre 2022 (2)
- septiembre 2022 (3)
- agosto 2022 (1)
- julio 2022 (3)
- junio 2022 (3)
- mayo 2022 (2)
- abril 2022 (2)
- marzo 2022 (2)
- febrero 2022 (2)
- enero 2022 (3)
- diciembre 2021 (2)
- octubre 2021 (5)
- septiembre 2021 (1)
- agosto 2021 (2)
- julio 2021 (2)
- junio 2021 (2)
- mayo 2021 (2)
- abril 2021 (1)
- marzo 2021 (1)
