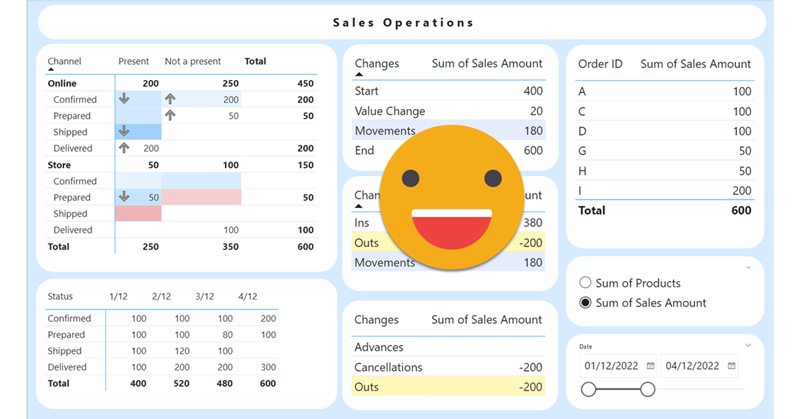
Hello there, yes, a third part of the snapshot report and I’m not even sure it’s the last one. The thing is that since the last post there has been some major improvements on the set up that I thought are worth sharing. In my previous post I ended up with a small defeat. There were some combinations of filters that when I drilled through to see all the historic records of those order IDs I would not get any rows. Also my set up included duplicating the fact table which is a big no-no in most use cases and a shameful solution from a modeler perspective. Even though this was the best I had, I decided to present the topic on two events, one was the Data Community Day Austria 2023 and the other was @PowerBIEspanol Virtual Conf 2023 (Fin Tour Power BI Days), just a few days apart. The fact that I had to present the solution to a lot of people kept me thinking and looking for solutions, so with the help of the always reliable Ricardo Rincón I finally found out a working solution just duplicating dimension tables and creating dimension tables for everything (even comments and stuff like that). That was much better but not quite scalable. In real life things are ugly and tables have many columns. So while fighting with the same use case at work, I found a sneakier and much better solution that got rid of all those superfluous dimension tables reducing the need of them to just 2. While preparing the presentations I also worked a bit on the report layer and I’ll also share some techniques I came up with that can be helpful at some point. But enough of all this talking, let’s do what? Let’s get to it.
Our Blog
CATEGORIES
- Esbrina (1)
- Fabric (1)
- Governance (6)
- Otros (1)
- Power BI (63)
- PowerApps (1)
- PowerAutomate (1)
- PowerShell (1)
TAGS
Circular Relationship
data quality
Apps
Reports
Powershell
swag
power query
PBIR
RLS
Data Validation
Dynamic Measure
Metadata
Dynamic SQL code
C# Scripts
Incremental Refresh
Custom dll
Hexadecimal encoding
Precedence
CSV
Binary
Zero-Width Chars
PowerQuery
hierarchy
Images
SQL Server
snapshot
security groups
Transparency
Power BI
REST API
Report
Time Intelligence
Governance
custom theme
Excel
Data Modeling
Chart
data mapping
Matrix
Visual Studio
Tooltip
conditional formatting
Field Parameters
Format String
Advanced Scripting
Tabular Editor
C# Script
DAX
Calculation Groups
ARCHIVES
- julio 2024 (2)
- mayo 2024 (2)
- abril 2024 (1)
- febrero 2024 (1)
- enero 2024 (1)
- diciembre 2023 (1)
- noviembre 2023 (2)
- octubre 2023 (1)
- julio 2023 (3)
- junio 2023 (2)
- mayo 2023 (2)
- abril 2023 (2)
- marzo 2023 (1)
- febrero 2023 (1)
- enero 2023 (1)
- diciembre 2022 (1)
- noviembre 2022 (2)
- octubre 2022 (2)
- septiembre 2022 (3)
- agosto 2022 (1)
- julio 2022 (3)
- junio 2022 (3)
- mayo 2022 (2)
- abril 2022 (2)
- marzo 2022 (2)
- febrero 2022 (2)
- enero 2022 (3)
- diciembre 2021 (2)
- octubre 2021 (5)
- septiembre 2021 (1)
- agosto 2021 (2)
- julio 2021 (2)
- junio 2021 (2)
- mayo 2021 (2)
- abril 2021 (1)
- marzo 2021 (1)
