The ultimate snapshot report (part 2)

Hello again. You didn’t think there would be a second part, right? well, me neither. But as things turn out, I had to work on another report dealing with snapshots, and this time they wanted something fancier. It took me a while to figure it out, but I like the result so I thought it would be nice to share. In the first part, we just showed what went up and what went down, being able to go back and check any snapshot. However, in many use cases that does not tell the whole story. To explain why something went up or down, you need to show what went in, what went out (sometimes important to tell which way it went) and maybe even if the value changed between snapshots. If we just compare 2 consecutive snapshots is not that hard, but things get trickier we take longer time spans and we want to account for everything that happened in between.
This time I will not go through all the trial and error because there has been A LOT of trial and error. I’ll just show you how I have put everything together, and if anyone has a better approach please share it with me, I’ll love to learn from it. The requirements that I tried my best to fulfill are:
- See current state of things in detail
- See evolution over time
- The story that explains changes between two snapshots (accounting for all in between)
- See the historic evolution of the relevant ids
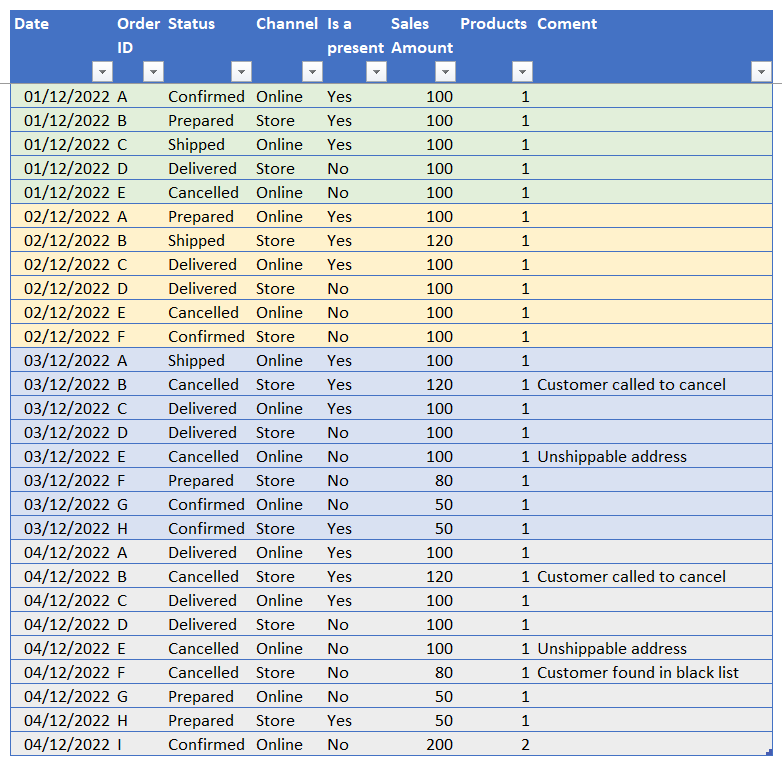
Here we have what could be a CRM snapshot fact table. Every day we download the whole list of orders (even those cancelled) with their status and some other attributes. For this use case I’m assuming that even cancelled orders will keep showing in snapshots. If that’s not the case we would need some more logic.
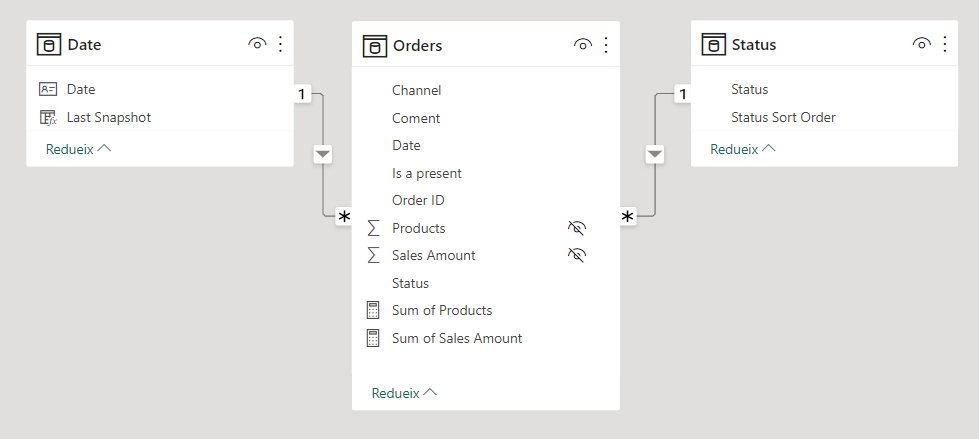
We proceed to load the table to Power BI and we create a super-simple calendar with a «Last Snapshot» calculated column, like we did in part 1 of this improvised series. When we build a matrix to show this last snapshot, we realize that the status (stati? statuses?) are not sorted correctly. To sort them properly we could add a column to the fact table, but auxiliary columns on the fact table are a big no-no. After all we want to set filters in tables other than the fact table, since this gives us most flexibility in our visualizations. So we build a small status table with the sort order. We set the correct sort order (Confirmed-Prepared-Shipped-Deliveded) and create the relationship with the fact table. While we are at it I also created the measures for the two numeric columns.
Lately I’m always (well, like almost always) using field parameters instead of straight measures in the visuals. Being able to switch all visuals from Value to Units feels like magical. And with field parameters you get even the names right everywhere. So anyway, I wanted to create a field parameter, but I really don’t like the UI for doing it. It’s slowish way of doing it. So what I did is take Daniel Otykier’s superb script and just made it «one-click» compliant adding a small dialog to let the user choose the field parameter name — this way can be used as a macro. Yes, you can get the modified script here
Now through all my dax battles with this model, I wanted to stay away of auto-exist so I set also super small tables for the channel and Is Present attributes, so I can avoid using the columns from the fact table altogether. As we’ll see later, this still not enough to get around some filter context thing I still do not understand, but hey, one thing at a time.
At this point we duplicate the date table (‘Date 2’), create a «model» calc group with a «Remove Date» calc Item (see previous article for detail) and we can already recreate what we had at the end of the first article of the series but with a different dataset. The calc item is applied to the bottom table to keep showing all dates (that come from 'Date 2' calendar) even when filtered from the top table. Here I show again the interactions, which are quite fun. Click on any cell of the table on top, you see the evolution on the bottom. Click on any date on the bottom, you see the detail on the top. But careful! you click on one state at the bottom… and you see the detail of all snapshots combined on the top, which makes 0 sense. Maybe I could do a DAX measure or something to hide the top table or show a warning. Did not do it this time though. Note: Both tables have a filter on status table that filters out any cancelled orders.
However, these visuals do not tell the whole story. Do we have new orders? Has any order been cancelled? Is the shipping department keeping up the workload?
Now it's time to flex our muscles, and to some serious DAX. After some thinking and testing, I decided that the best way to explain the changes between 2 different points in time is in three levels:
- Level 1:
- Start
- Value Change
- Movements
- End
- Level 2:
- Ins
- Outs
- Movements
- Level 3:
- Advancements
- Cancellations
- Outs
As you can see Level 2 is a breakdown of «Movements» and level 3 is a breakdown of «Outs». If all the numbers match, the user can trust the numbers and all is good. Now before we get into DAX, let’s remember we have a range of dates coming from ‘Date 2’ table. The reason I add a ‘value change’ category is to be able to show all values (apart from Start and Value change, of course) in End-date value, so they add up. Otherwise I would have to explain the differences for each category and that’s a pain.
We create a calc group called «Changes» and let’s start with the easy ones, Start and End.
-------------------------------
-- Calculation Group: 'Changes'
-------------------------------
CALCULATIONGROUP 'Changes'[Changes]
    Precedence = 10

    CALCULATIONITEM "Start" =
        IF (
            SELECTEDMEASURENAME () IN VALUES ( 'Measure'[Measure Name] ),
            VAR endDate =
                MAX ( 'Date 2'[Date] )
            VAR startDateAux =
                MIN ( 'Date 2'[Date] )
            VAR startDate =
                IF (
                    startDateAux < endDate,
                    startDateAux,
                    VAR previousDate =
                        CALCULATE ( MAX ( 'Orders'[Date] ), 'Orders'[Date] < endDate, REMOVEFILTERS () )
                    RETURN
                        COALESCE ( previousDate, startDateAux )
                )
            VAR result =
                CALCULATE ( SELECTEDMEASURE (), 'Date 2'[Date] = startDate )
            RETURN
                result,
            SELECTEDMEASURE ()
        )
        Ordinal = 0

    CALCULATIONITEM "End" =
        IF (
            SELECTEDMEASURENAME () IN VALUES ( 'Measure'[Measure Name] ),
            VAR endDate =
                MAX ( 'Date 2'[Date] )
            VAR result =
                CALCULATE ( SELECTEDMEASURE (), 'Date 2'[Date] = endDate )
            RETURN
                result,
            SELECTEDMEASURE ()
        )
        Ordinal = 7
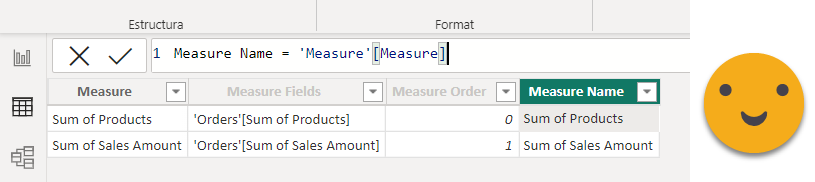
A couple things about this code. The first is that «Measure» is the field parameter, and «Measure Name» is a calculated column that takes the value from the first column of the field parameter. This way it does not complain when you use it as a regular column. If you try to use the first column you get some dax error and you need a much more convoluted dax to use it. I got this piece of wisdom from Kane Snyder on Twitter.
This way the calculation group only acts on the measures we added to the field parameter, which makes a lot of sense IMO. The other thing is how we calculated the start date. As I said earlier, we should have a range of dates, but if we’re using the date 2 in a visual, for each cell we would have only one date. For such cases I create the logic to pick the previous date with data in the fact table, and if there’s none then I stay with the minimum date of the filter context. Other than this little two things, the the rest is quite straight forward.
Now let’s get to the value change one which is trickier. Here we want to take the order Ids we have at the beginning, evaluate them on the beginning and end, keep only those that have different values, and return the aggregated value difference «end-start». We need to be careful that on the final snapshots those Ids can be out of the filter context if they have moved or cancelled for instance.
-------------------------------
-- Calculation Group: 'Changes'
-------------------------------
CALCULATIONGROUP 'Changes'[Changes]
    Precedence = 10

    CALCULATIONITEM "Value Change" =
        IF (
            SELECTEDMEASURENAME () IN VALUES ( 'Measure'[Measure Name] ),
            VAR endDate =
                MAX ( 'Date 2'[Date] )
            VAR startDateAux =
                MIN ( 'Date 2'[Date] )
            VAR startDate =
                IF (
                    startDateAux < endDate,
                    startDateAux,
                    VAR previousDate =
                        CALCULATE ( MAX ( 'Orders'[Date] ), 'Orders'[Date] < endDate, REMOVEFILTERS () )
                    RETURN
                        COALESCE ( previousDate, startDateAux )
                )
            VAR initialIds =
                CALCULATETABLE ( VALUES ( 'Orders'[Order ID] ), 'Date 2'[Date] = startDate )
            VAR idsAndValues =
                ADDCOLUMNS (
                    initialIds,
                    "@Initial Value", CALCULATE ( SELECTEDMEASURE (), 'Date 2'[Date] = startDate ),
                    "@Final Value",
                        CALCULATE (
                            SELECTEDMEASURE (),
                            'Date 2'[Date] = endDate,
                            ALLEXCEPT ( 'Orders', 'Orders'[Order ID] ),
                            REMOVEFILTERS ( 'Status' )
                        )
                )
            VAR idsValueChange =
                SELECTCOLUMNS (
                    FILTER ( idsAndValues, [@Initial Value] <> [@Final Value] ),
                    "Order ID", 'Orders'[Order ID]
                )
            VAR initialValue =
                CALCULATE (
                    SELECTEDMEASURE (),
                    KEEPFILTERS ( idsValueChange ),
                    'Date 2'[Date] = startDate
                )
            VAR finalValue =
                CALCULATE (
                    SELECTEDMEASURE (),
                    KEEPFILTERS ( idsValueChange ),
                    'Date 2'[Date] = endDate,
                    ALLEXCEPT ( 'Orders', 'Orders'[Order ID] ),
                    REMOVEFILTERS ( 'Status' )
                )
            VAR result = finalValue - initialValue
            RETURN
                result,
            SELECTEDMEASURE ()
        )
        Ordinal = 1
Here this might not be the most efficient DAX implementation, but it ensures that it will only return a result for orders that indeed changed the value, without any 0’s for those that did not. I’m already quite happy that it returns the right value so at this point I’m not touching it further. Notice the ALLEXCEPT and REMOVEFILTERS when evaluating the measure at the final date.
With Value Change we only explain the value fluctuations that the initial orders had between the initial snapshot and the final snapshot. From there to reach the final value we need to explain the movements that took place, ins and outs combined. We could take end – (start+value change) but that would be cheating and we would not know if we got our dax wrong. So we’ll to it properly.
-------------------------------
-- Calculation Group: 'Changes'
-------------------------------
CALCULATIONGROUP 'Changes'[Changes]
    Precedence = 10

    CALCULATIONITEM "Movements" =
        IF (
            SELECTEDMEASURENAME () IN VALUES ( 'Measure'[Measure Name] ),
            VAR endDate =
                MAX ( 'Date 2'[Date] )
            VAR startDateAux =
                MIN ( 'Date 2'[Date] )
            VAR startDate =
                IF (
                    startDateAux < endDate,
                    startDateAux,
                    VAR previousDate =
                        CALCULATE ( MAX ( 'Orders'[Date] ), 'Orders'[Date] < endDate, REMOVEFILTERS () )
                    RETURN
                        COALESCE ( previousDate, startDateAux )
                )
            VAR initialIds =
                CALCULATETABLE ( VALUES ( 'Orders'[Order ID] ), 'Date 2'[Date] = startDate )
            VAR finalIds =
                CALCULATETABLE ( VALUES ( 'Orders'[Order ID] ), 'Date 2'[Date] = endDate )
            VAR newIds =
                EXCEPT ( finalIds, initialIds )
            VAR idsGone =
                EXCEPT ( initialIds, finalIds )
            VAR newIdsValue =
                CALCULATE (
                    SELECTEDMEASURE (),
                    KEEPFILTERS ( 'Orders'[Order ID] IN newIds ),
                    'Date 2'[Date] = endDate
                )
            VAR idsGoneValue =
                CALCULATE (
                    SELECTEDMEASURE (),
                    KEEPFILTERS ( 'Orders'[Order ID] IN idsGone ),
                    'Date 2'[Date] = endDate,
                    ALLEXCEPT ( 'Orders', 'Orders'[Order ID] )
                )
            VAR result = newIdsValue - idsGoneValue
            RETURN
                result,
            SELECTEDMEASURE ()
        )
        Ordinal = 6
In this case since we just want to show the aggregated values of ins and outs, and we always to such calculations on the end-date value, we do not need to take into account posible in-outs that happened between both snapshots. Here I’m not using REMOVEFILTERS on the status table, but yet I’m getting correct values so it might not be necessary after all. This article is a way to get DAX guru’s into the conversation. There are several mysteries that I haven’t solved, some of them coming later.
So that’s it for «Level 1» of our story telling «What happened between both snapshots». Let’s get into level 2 which is yet a bit trickier (but less than level 3). Now we want to show all the new orders that we had and all those that are not there anymore. This analysis has some value in general terms but gets even more interesting when we filter down to some state or condition. If you work in the shipping department of Santa Claus, and you compare snapshots of the «shipped» status between Dec 20 and Dec 29, you really need to take into account all the snapshots or otherwise the report will show you did nothing.
-------------------------------
-- Calculation Group: 'Changes'
-------------------------------
CALCULATIONGROUP 'Changes'[Changes]
    Precedence = 10

    CALCULATIONITEM "Ins" =
        IF (
            SELECTEDMEASURENAME () IN VALUES ( 'Measure'[Measure Name] ),
            VAR endDate =
                MAX ( 'Date 2'[Date] )
            VAR startDateAux =
                MIN ( 'Date 2'[Date] )
            VAR startDate =
                IF (
                    startDateAux < endDate,
                    startDateAux,
                    VAR previousDate =
                        CALCULATE ( MAX ( 'Orders'[Date] ), 'Orders'[Date] < endDate, REMOVEFILTERS () )
                    RETURN
                        COALESCE ( previousDate, startDateAux )
                )
            VAR initialIds =
                CALCULATETABLE ( VALUES ( 'Orders'[Order ID] ), 'Date 2'[Date] = startDate )
            VAR allPosteriorIds =
                CALCULATETABLE (
                    VALUES ( 'Orders'[Order ID] ),
                    DATESBETWEEN ( 'Date 2'[Date], startDate + 1, endDate )
                )
            VAR newIdsAtSomePoint =
                EXCEPT ( allPosteriorIds, initialIds )
            VAR newIdsValue =
                CALCULATE (
                    SELECTEDMEASURE (),
                    'Orders'[Order ID] IN newIdsAtSomePoint,
                    'Date 2'[Date] = endDate,
                    ALLEXCEPT ( 'Orders', 'Orders'[Order ID] ),
                    REMOVEFILTERS ( 'Status' )
                )
            VAR result = newIdsValue
            RETURN
                result,
            SELECTEDMEASURE ()
        )
        Ordinal = 2
Here notice the DATESBETWEEN. We want to capture all the Order ID’s that showed up in the filter context between the next snapshot of the initial one and the final snapshot. Some of them may be out again before the final snapshot, but we want to account for them as well. As usual, we evaluate them in the end date to make things add-up.
Outs is very similar:
-------------------------------
-- Calculation Group: 'Changes'
-------------------------------
CALCULATIONGROUP 'Changes'[Changes]
    Precedence = 10

    CALCULATIONITEM "Outs" =
        IF (
            SELECTEDMEASURENAME () IN VALUES ( 'Measure'[Measure Name] ),
            VAR endDate =
                MAX ( 'Date 2'[Date] )
            VAR startDateAux =
                MIN ( 'Date 2'[Date] )
            VAR startDate =
                IF (
                    startDateAux < endDate,
                    startDateAux,
                    VAR previousDate =
                        CALCULATE ( MAX ( 'Orders'[Date] ), 'Orders'[Date] < endDate, REMOVEFILTERS () )
                    RETURN
                        COALESCE ( previousDate, startDateAux )
                )
            VAR allIdsUntilpreviousDate =
                CALCULATETABLE (
                    VALUES ( 'Orders'[Order ID] ),
                    DATESBETWEEN ( 'Date 2'[Date], startDate, endDate - 1 )
                )
            VAR finalIds =
                CALCULATETABLE ( VALUES ( 'Orders'[Order ID] ), 'Date 2'[Date] = endDate )
            VAR disappearedIDs =
                EXCEPT ( allIdsUntilpreviousDate, finalIds )
            VAR disappearedIdsValue =
                CALCULATE (
                    SELECTEDMEASURE (),
                    'Orders'[Order ID] IN disappearedIDs,
                    'Date 2'[Date] = endDate,
                    REMOVEFILTERS ( 'Orders' ),
                    REMOVEFILTERS ( 'Status' )
                )
            VAR result = - disappearedIdsValue
            RETURN
                result,
            SELECTEDMEASURE ()
        )
        Ordinal = 5
Here the only difference is that we capture in one hand all the ids that showed up in the initial snapshot and any other snapshot before the final one. All those that are not in the final snapshots are outs. As usual we evaluate them on end date regardless of the state in which they are.
And that’s it for Level 2. Now we get to Level 3 which is the tricky one. How can we tell apart those that disappeared because they were cancelled from those that advanced (and maybe were then cancelled) ? Here I’m assuming that orders either go forward or are cancelled. For workflows in which things can go back the logic might be a bit trickier. For my use case the logic I follow is: From those that have disappeared, are there any that have been seen in a status above the current one and cancelled? Those are the ones that advanced. The rest were cancelled right away. Let’s see how this plays out.
-------------------------------
-- Calculation Group: 'Changes'
-------------------------------
CALCULATIONGROUP 'Changes'[Changes]
    Precedence = 10

    CALCULATIONITEM "Advances" =
        IF (
            SELECTEDMEASURENAME () IN VALUES ( 'Measure'[Measure Name] ),
            VAR endDate =
                MAX ( 'Date 2'[Date] )
            VAR startDateAux =
                MIN ( 'Date 2'[Date] )
            VAR startDate =
                IF (
                    startDateAux < endDate,
                    startDateAux,
                    VAR previousDate =
                        CALCULATE ( MAX ( 'Orders'[Date] ), 'Orders'[Date] < endDate, REMOVEFILTERS () )
                    RETURN
                        COALESCE ( previousDate, startDateAux )
                )
            VAR allIdsUntilpreviousDate =
                CALCULATETABLE (
                    VALUES ( 'Orders'[Order ID] ),
                    DATESBETWEEN ( 'Date 2'[Date], startDate, endDate - 1 )
                )
            VAR finalIds =
                CALCULATETABLE ( VALUES ( 'Orders'[Order ID] ), 'Date 2'[Date] = endDate )
            VAR disappearedIDs =
                EXCEPT ( allIdsUntilpreviousDate, finalIds )
            VAR currentStatus =
                MAX ( 'Status'[Status Sort Order] )
            VAR statusForDirectlyCancelledIds =
                SELECTCOLUMNS (
                    FILTER (
                        ALL ( 'Status' ),
                        'Status'[Status Sort Order] <= currentStatus
                            || 'Status'[Status Sort Order] = "99"
                    ),
                    "Status", 'Status'[Status]
                )
            VAR advancedIds =
                CALCULATETABLE (
                    VALUES ( 'Orders'[Order ID] ),
                    'Orders'[Order ID] IN disappearedIDs,
                    NOT 'Orders'[Status] IN statusForDirectlyCancelledIds,
                    DATESBETWEEN ( 'Date 2'[Date], startDate + 1, endDate ),
                    REMOVEFILTERS ( 'Status' )
                )
            VAR advancedIdsValue =
                CALCULATE (
                    SELECTEDMEASURE (),
                    'Orders'[Order ID] IN advancedIds,
                    'Date 2'[Date] = endDate,
                    REMOVEFILTERS ( 'Orders' ),
                    REMOVEFILTERS ( 'Status' )
                )
            VAR result = - advancedIdsValue
            RETURN
                result,
            SELECTEDMEASURE ()
        )
        Ordinal = 3
As you see we get the maximum order of the status that is currently in the filter context and get all the status that are equal or below that number along with 99 the sort number for «Cancelled». Advanced Ids are those that are seen with a different status at any point from the snapshot next to the initial one and the final one included.
Those that were cancelled are those that did not advance and are not in the final filter context
-------------------------------
-- Calculation Group: 'Changes'
-------------------------------
CALCULATIONGROUP 'Changes'[Changes]
    Precedence = 10

    CALCULATIONITEM "Cancellations" =
        IF (
            SELECTEDMEASURENAME () IN VALUES ( 'Measure'[Measure Name] ),
            VAR endDate =
                MAX ( 'Date 2'[Date] )
            VAR startDateAux =
                MIN ( 'Date 2'[Date] )
            VAR startDate =
                IF (
                    startDateAux < endDate,
                    startDateAux,
                    VAR previousDate =
                        CALCULATE ( MAX ( 'Orders'[Date] ), 'Orders'[Date] < endDate, REMOVEFILTERS () )
                    RETURN
                        COALESCE ( previousDate, startDateAux )
                )
            VAR allIdsUntilpreviousDate =
                CALCULATETABLE (
                    VALUES ( 'Orders'[Order ID] ),
                    DATESBETWEEN ( 'Date 2'[Date], startDate, endDate - 1 )
                )
            VAR finalIds =
                CALCULATETABLE ( VALUES ( 'Orders'[Order ID] ), 'Date 2'[Date] = endDate )
            VAR disappearedIDs =
                EXCEPT ( allIdsUntilpreviousDate, finalIds )
            VAR currentStatus =
                MAX ( 'Status'[Status Sort Order] )
            VAR statusForDirectlyCancelledIds =
                SELECTCOLUMNS (
                    FILTER (
                        ALL ( 'Status' ),
                        'Status'[Status Sort Order] <= currentStatus
                            || 'Status'[Status Sort Order] = "99"
                    ),
                    "Status", 'Status'[Status]
                )
            VAR advancedIds =
                CALCULATETABLE (
                    VALUES ( 'Orders'[Order ID] ),
                    KEEPFILTERS ( 'Orders'[Order ID] IN disappearedIDs ),
                    NOT 'Orders'[Status] IN statusForDirectlyCancelledIds,
                    DATESBETWEEN ( 'Date 2'[Date], startDate + 1, endDate ),
                    REMOVEFILTERS ( 'Status' )
                )
            VAR cancelledIds =
                EXCEPT ( disappearedIDs, advancedIds )
            VAR cancelledIdsValue =
                CALCULATE (
                    SELECTEDMEASURE (),
                    KEEPFILTERS ( 'Orders'[Order ID] IN cancelledIds ),
                    'Date 2'[Date] = endDate,
                    REMOVEFILTERS ( 'Orders' ),
                    REMOVEFILTERS ( 'Status' )
                )
            VAR result = - cancelledIdsValue
            RETURN
                result,
            SELECTEDMEASURE ()
        )
        Ordinal = 4
And that's it for the calc group! Notice that for outs, advances and cancellations we put the number in negative since they explain a reduction of orders in the filter context. This alone already provides a lot of joy in the report. If you notice the ordinal numbers, I've ordered calc items in a way that can show the Level 1 2 and 3 in different tables. If you put them all together it's just too hard to follow and aggregates bring value too. The thing is that leaving all the interactions is cool, but sometimes difficult to understand… let's see this with a video
As you see we get a lot of cool information about any cell. You can see too that there's a lot of heavy lifting with DAX so it might be best suited for use cases with few ids but that a lot of detail is needed, for instance if you are into real estate is a big deal if an offer falls half-way through. Anyway, as you see at the end of the video, the Ins value is 380, however, the total of ins for each date (from 2 to 4 of December) is 400. What is going on?
Here we need to think about filter context like a lot. Remember how we pick start date. If min date < max date we leave it as is, otherwise we pick the previous snapshot to the end date. Here what is happening is that the Ins we had on the 2nd of December have changed value during the period, so if I take the time range 1-4 of December I'll be evaluating Ins at 4th of December while on the table I'm evaluating Ins for each date. This value fluctuation does not show in level 1 because this order id is an In so by definition is not included. The only way for all numbers to make sense always would be to evaluate the numbers of the bottom table always with the end date of the shadow filter context… but this could bring more confusion than clarity. Anyway, a simpler solution could be to remove interaction from the changes table to the bottom table at least, though it's cool to know when new entries or cancellations happened. Just remember that total is not the sum of individual values… wait, let's not open that topic again! ^_^;
Let's move on… what's the next thing that the user will want to know? WHAT ORDERS ARE THEY? sometimes they don't believe that there has been a value change, so it's good to be able to show it when it happens. Also in any filtering is good to know what orders are included from large to small, so they have a clear direction on where they need to focus. With the beauty of the tabular model this is rather easy. We'll just add a table slicing by Order ID, order by (field parameter) measure value and off we go!
So here we see that in the filter context Online + Prepared + Last Snapshot we have 50 (€?) and apparently we had nothing on day 1. This 50 come from Order ID = "G". Yet we can see that there has been Ins worth 150 and outs worth -100. If we Ctrl+click on Ins (otherwise the initial filter is lost) we can see that order A was also in this same situation at some point. Checking at the bottom table that is not there anymore because it has advanced to the next status. Isn't that cool? That's some powerful storytelling on what happened with the orders.
However, in some cases the user may want to know more about an order or group of orders. And now is when we enter to the utimate DAX hell where I've been battling the last week or so.
What I want is to show the all the records of the orders table for the relevant orders. Does not sound that hard right? Well, it is, at least to me. To be honest I have not succeeded, so what I've done is build the best workaround I could come up with. Actually, though, for a single order is not that hard.
We set up a table in another page with all the columns of the orders table. Then set the order ID as the drill through field, and disable "keep all filters". In order to pass the date range we can set up a sync'd slicer and it works like charm.
The complete hell I have not been able to solve is if I want to see a group of Order IDs together. In theory it does not look that hard — with ALLSELECTED I should be able to grab all the order Ids to show and then check the order Id of the filter context of the table visual and if they match return a 1 and otherwise a blank to hide the rest of orders. Well, using the same Orders table I have not found any way to do it, and I've tried everything I have. So the only real working way of doing what I want is –yes– duplicating the fact table (!) and that's not like super easy either. And there's even some edge cases that FOR SOME REASON do not work either.
We create a new page of the report and we set a table with the "Orders 2" columns along with a simple measure (like a COUNTROWS) to be able to control row visibility with a calc group. Next we create the new calc group. (I don't add it as a new calc item of the 'Model' Calc group because another calc item of the same group might be part of the filter context already).
-------------------------------
-- Calculation Group: 'Model 2'
-------------------------------
CALCULATIONGROUP 'Model 2'[Model 2]
    Precedence = 30

    CALCULATIONITEM "Order IDs on Orders 2" =
        VAR ids =
            SELECTCOLUMNS (
                FILTER (
                    CALCULATETABLE (
                        ADDCOLUMNS ( VALUES ( 'Orders'[Order ID] ), "@measure", [Sum of Sales Amount] ),
                        ALLSELECTED ()
                    ),
                    NOT ISBLANK ( [@measure] )
                ),
                "Order ID", 'Orders'[Order ID]
            )
        VAR currentID =
            VALUES ( 'Orders 2'[Order ID] )
        RETURN
            IF ( currentID IN TREATAS ( ids, 'Orders 2'[Order ID] ), 1, BLANK () )
Here indeed we evaluate a measure on all the order ids of the shadow filter context just to get the list of orders we need to show. Next we pick the order id but now from 'Orders 2' table and finally we return 1 only if it belongs to the order Ids we need to show. To show only the dates of the date range we can create a relationship with the 'Date 2' table and 'Orders 2'. But if the user wants to see "Everything" then we can just leave it disconnected.
This solution works well from all the different tables, but when we combine a filter from the main table with one of the changes table and then drill through then no Order IDs are shown or sometimes not all relevant IDs are shown… If anyone understands why, please let me know. And "That's because of the filter context" is not accepted as an answer — let me know why 😀
The good news is that I would bet that 99% of the users do not know you can combine filters from different visuals, so I guess it's good enough. Bad news is that as you saw, even with little data this is already slowish, so don't use this unless explicitly called for. Or if you can optimize it please tell me how!
With Carles from Esbrina we had some discussions about the modeling part — he argued that a pos-neg fact table would solve all the problems, and I was rather reluctant to do that. First it introduces a process overhead… one more thing that can go wrong so to say. Then some of the answers are not easily answered by the fact table either. Show me orders that changed their value, Orders that advanced…. Anyway, this is already long and tough enough so I’ll leave it here. I might come back at some point to bring some «aging» perspective to the report… how long has an order been into «prepared» without being shipped? When analyzing how many orders are in some state it does bring a lot if insight putting them into sub-buckets by how long have they been there. This may help define the action plan to solve certain bottleneck.
Please download the pbix and play with it. If you find a way of doing what this one does without some of extra tables, please let me know. I do think is a pretty general use case so I hope some day to even automate the implementation a bit.
Thank you for reading all the way until here 🙂
Please follow the conversation on Twitter and LinkedIn
if your are just looking for the script to crate field parameters here it is: Script to create field parameters