Dynamic headers in Power BI, sort of.

Well, I was happy with the result, but I was even more happy with the reaction on twitter. The dynamic header effect felt like magical to many people, and well, I have many more followers now, thank you all.
In case you haven't seen it, here's the video
So how did I do it? Short answer: Field parameters. A little longer answer: Measures and a calculation group create more measures that are put in field parameter with some customization.
Even longer answer? Let's do it.
Going back in time my first «hit» was this blog post, a C# Script that would build a Time Intelligence Calculation Group using the expressions from DAXPatterns.com. Along with the calculation group, the script also creates two measures that work as a dynamic label either as value (text measure) or as format string (the measure value is 0, but the data label would show the dynamic label text). However, being a measure, the real usage was limited. Normally we want such things in the legend or in the column headers. Today we’ll see a pretty wild workaround due to the fact that as of today, Power BI does not offer dynamic headers. This calculation group and the dynamic label measure are one piece of the puzzle. For those not familiar with it, the script creates a calculation group with the following calculation items:
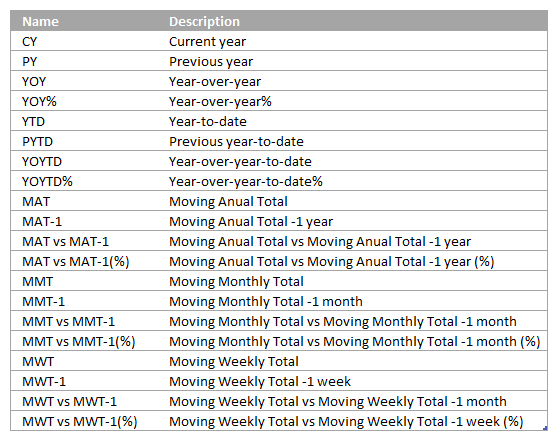
After YOYTD% names get a bit weird, but I think can be understood well. So What about the calculations and dynamic label? It looks like this:
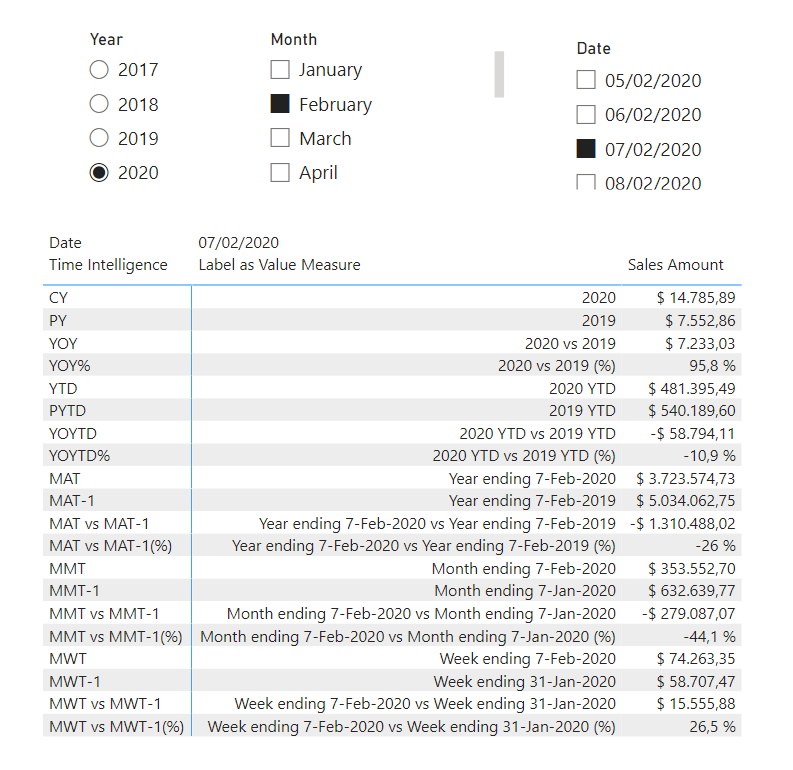
I know, dynamic labels are way too long but that’s the best I could came up with. Please ping me for better labels.
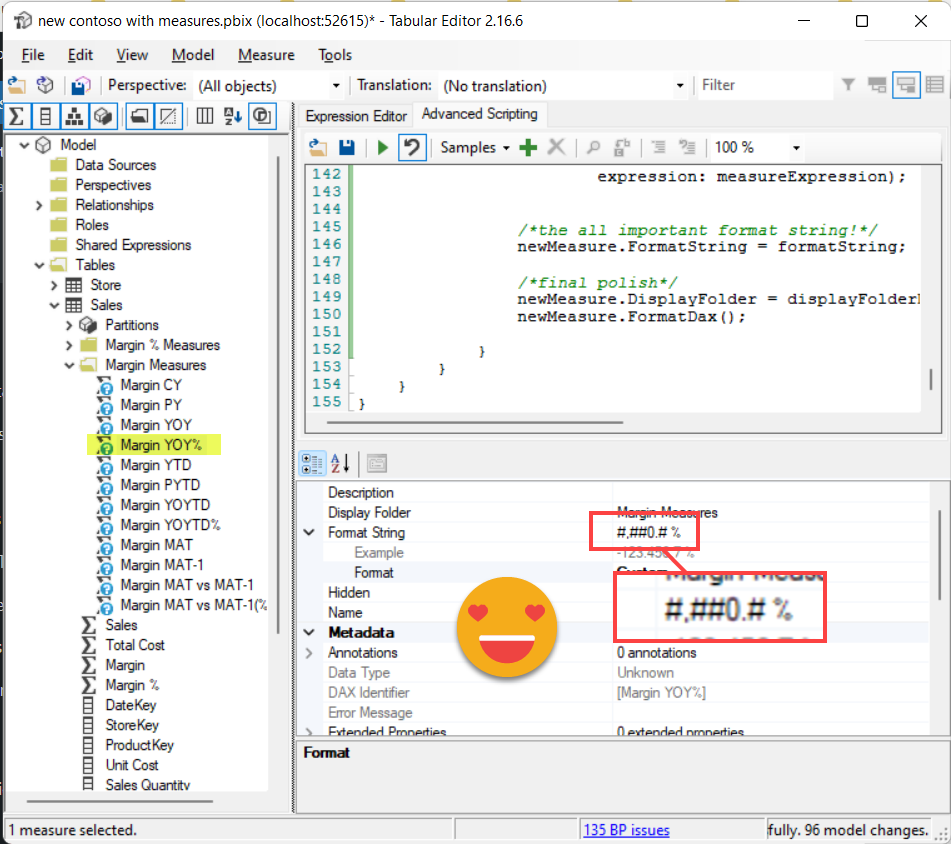
Then there is another important building block that I laid out in this other post, a C# script that given one or more measures and a calculation group it will create the measures for each calculation item, and with the appropriate format string. This last part is trickier than it sounds, since with calculation items you have to evaluate a DAX expression in order to get the format string that will be applied. As a recap, it creates an auxiliary calculation group that as a value expression that is just SELECTEDMEASUREFORMATSTRING() so this way you can extract the resulting format string of any measure even after the application of one or more calculation groups. The script creates a value expression using a CALCULATE and applying the calc item, and for the format string evaluates the same CALCULATE expression with the extra calc group on top so the format string is returned and used as the now static format string. This technique will be used again in today’s script. Check the blog post for details.
The third building block is this other blog post. Here I built on the previous blog post and went one step further: After creating all the measures using the calculation group, I created a Field Parameter with two extra columns, one with the base measure name and one with the calculation item name. The Field parameter created by the script looks like this:
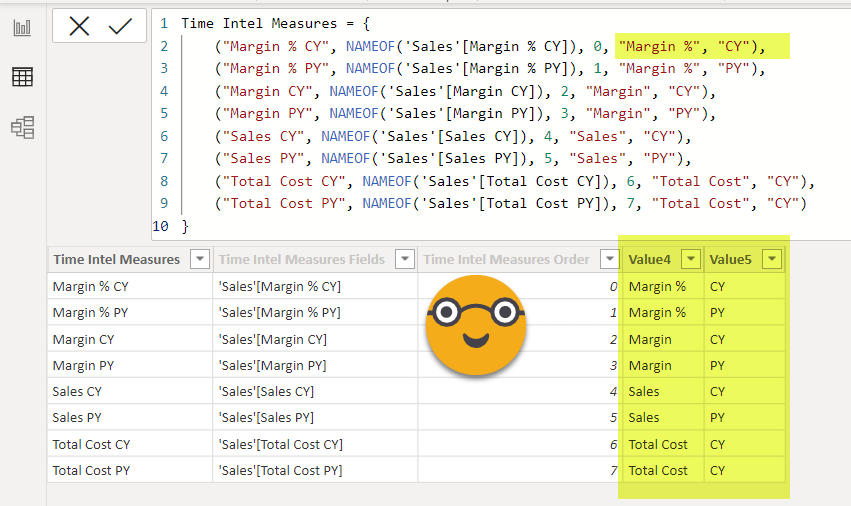
This provides a better legend that you would have otherwise, but still leaves you wondering for a sec who is CY and who is PY in the current filter context
So I decided to take it one step further and use that measure from the initial blog post to build the name that should be used for the first column of the field parameter, which is what is shown as the name in visuals. When we create a field parameter, some automatic names are created for us, but nothing stops us from modifying them. However, I wanted to show a different name depending on the year that is selected! How can I achieve that? Well, there is no such thing as dynamic labels in Power BI (at least on January 23, 2023) so the only alternative is … creating a measure for each of the years! Yep, that’s a lot of measures, but the good thing is that the script can take care of that too.
To execute it you need to select one or more measures, or store the script as a macro and choose to show it on measures’ right-click menu.
(Feel free to download the script and follow along)
So basically the script does:
- Asks if field parameter should be created (in this use case it’s totally required to do anything useful with the truckload of measures you’ll get)
- Checks that there are measures selected
- Checks if there is a regular calculation group (the script later creates an auxiliary one)
- Checks if the auxiliary group is in place, if not it creates it and requires the user to save changes, recalculate the model and execute the script again (this is required because we will do queries with this calc group to get the correct format strings of the measures)
- Asks the user to select the Calculation Group to generate the measures
- Asks the user the table where the filter column is (for year that would be the date table)
- Asks for the filter column (the year column)
- It creates a query to get the distinct values and evaluates it using ExecuteReader, putting all the values in a list ( I don’t know how to do it otherwise). Also you cannot have two ExecuteReader open simultaneously and we’ll need another one.
- Then it asks for the dynamic label measure (optional, but necessary for a good effect)
- For each measure checks that it has a proper format string and otherwise warns the user and stops execution
- Defines a display folder for all the measures related to the base measure
- Iterates for each of the calculation items of the calc group selected in step 5
- Using the calculation group ordinal column creates an invisible prefix with 0 with white spaces to make sure that all the labels we’ll create are different (I’m not 100% sure this is necessary, but without it, the script would not generate the field parameter).
- Iterates for each of the filter values
- Defines the measure name as, <base measure name> <calc item name> <filter value>
- Then defines the dynamic measure name: if no measure was selected in step 9, it will pick the same of the measure name. Otherwise the dynamic measure name is <base measure name> <dynamic label>, where ‘dynamic label’ is a the result of a query evaluating a CALCULATE statement with the dynamic label measure, the calculation item and the filter column = filter value Something like: CALCULATE([Label as value], ‘Time Intelligence'[Time Intelligence] = «YOY», ‘Date'[Year] = 2020), which will return «2020 vs 2019». The dynamic measure name becomes «Sales Amount 2020 vs 2019» which is the whole point.
- The expression for the measure is created with the base measure, the calculation item and the filter column = filter value with a KEEPFILTERS around the last one to prevent people from misusing it a bit.
Margin YOY 2020 =
CALCULATE(
    [Margin],
    'Time Intelligence'[Time Intelligence] = "YOY",
    KEEPFILTERS( 'Date'[Year] = 2020 )
)
- Now it’s time to evaluate the format string of the measure… or well maybe this could be done outside the iteration of the values — I just realized that. The query would be something like:
EVALUATE
{ CALCULATE([Margin],Time Intelligence'[Time Intelligence] = "YOY", 'DELETE AUX CALC GROUP'[Name] = "Get Format String" ) }
No need to include the filter column this time as the format string will not change (thus could be evaluated before the value iteration loop)
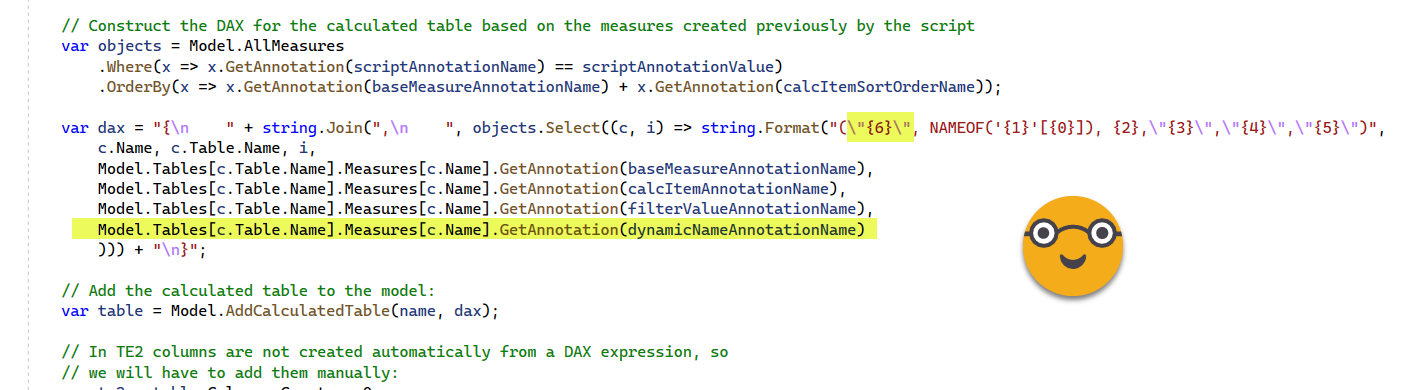
- Now with everything in place it finally creates the measure in the display folder, with the expression, format string and a bunch of annotations: One with the same value for all created measures by the script on this run to be able to pick them up later and build the field parameter, one with the calc item order to be able to sort the measures in the same way as the calculation items, then one for the base measure name, another the calc item name and the filter value. And of course the ‘dynamic’ name too.
- Adding them into annotations was the only way I found to pull out this information on the super compact expression that Daniel Otykier used on his script to create the field parameters and that I shamelessly borrowed. Then I customized it to add the extra columns and replace the first column with the dynamic name. Maybe now that all are measures this can be written in a simpler way, but «if ain’t broke don’t touch it» they say, and this statement is quite like sorcery to me anyway, so I touch it the least I can.
And that’s pretty much it! Coding for this script took longer because I took the opportunity to start building the definitive custom class for my scripts. I have now rather sophisticated functions to select a table, select a calculation group, or create a calculation group and calculation item. If I ever need them even more sophisticated I only have to code a little more. I did that with excel a long time ago and it really pays of. I do code a lot less for Power BI than for excel, but we’ll eventually get there too I guess.
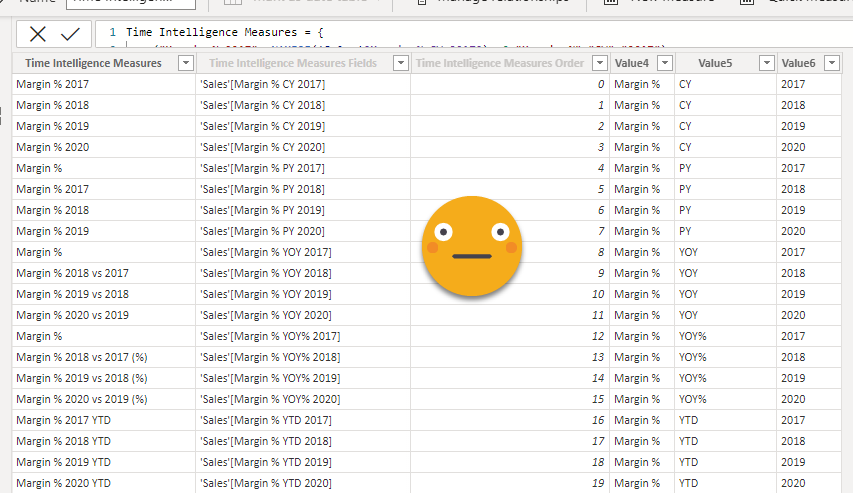
Well wait. With the script we only get the field parameter, a huge one like this (320 rows):
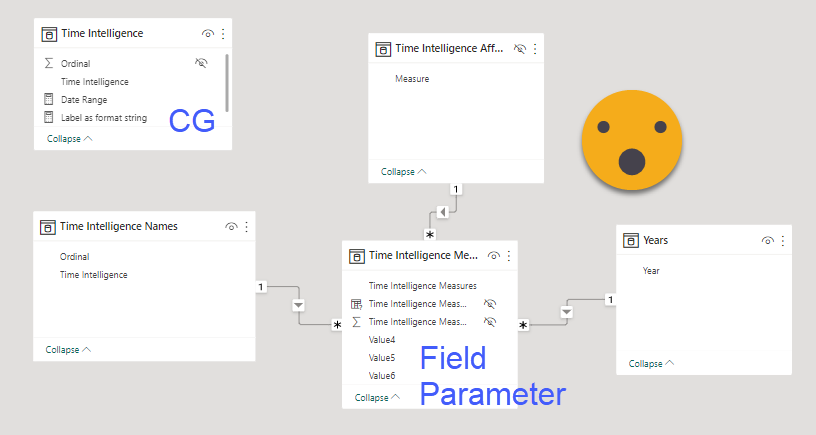
To use this field parameter you might want to build the filter tables for the slicers you saw on the video on top. For that I reused the table of «Time Intelligence Affected Measures» which already contains the names of the measures we are using (most likely). Now for calculation items you can’t just create a relationship with the calculation group, so you might want to create a calc table that is equal to the calc group table. It will contain just the names, but none of the wizardy, so it’s great as a dimension containing all the calc item names. You could enrich that with a nicer names of course. Finally for years you will probably need to a year table. With that you can build like a star schema around your field parameter — how cool is that?
Well but if you just want to use the values included in the field parameter you can probably do without the dimension tables now that I think of it. Anyway, at the end you do get the magic effect of having a dynamic header, but as you see the price (even if it's just a script) is not cheap. Make sure you document how you got it working in case someone inherits your model and is asked to add a new measure to the mix. Just delete it and recreate using the same name for the field parameter — it should just work. No warranty on that either though! Use that in production only if you really have to. I hope we'll eventually get dynamic headers — they could be just a measure like the "dynamic label as value" one and that would save us a lot of trouble. In the meantime we can rewatch the video
Here you can find the script and the pbix
Thank you for reading and please follow the conversation on Twitter and LinkedIn