A dynamic legend for a dynamic measure + time intel chart

Well it’s no secret that I like calc groups. But it’s also true that calc groups have an achiles heel. Calc Item names are constant, so for charts, legends stay the same no matter what. Depending on your use case you might get away with it, but sometimes you might get an end user that will not buy it — and he or she might be an important person, so it’s always good to have a Plan B. Field Parameters have brought fresh air, and indeed are great for such use cases because it’s not like you modify the DAX of the measure in the chart, you actually change the measure, so the name shown in the legend also changes, which is great. However, what happens if you want to create a chart where the user can pick from 4 KPI’s and say 8 time intel calculations?? First you’ll have to create the measures, then the field parameter, then figure out how to model that for the user to be able to select measure and calculation intependently… I mean it’s not impossible, but looks long and boring. Let’s see what we can do about it!
I start as usual with the contoso model with a few measures: Sales, Margin, Margin %, Total Cost.
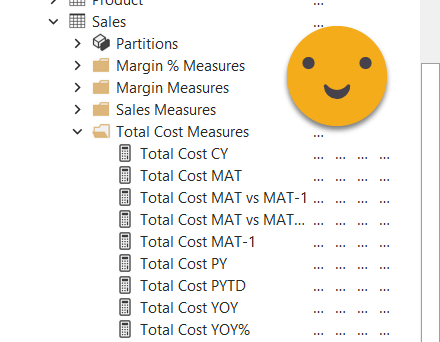
Next we need to put together the measures with the time calculations in place, all following a clean naming pattern. We could do them by hand — we could even look around and create them directly with some scripts, but then we would have the logic replicated all around and would be a bit messy to manage if we later wanted to fine tune that. Instead we’ll first create the time intel calc group, which already has good expressions for value and format strings, right out of daxpatterns.com so we don’t have to reinvent the wheel. If you don’t know what I’m talking about, go check out the original post, or go straight to the toolbelt blog post which has detailed instructions on how to run it. But what about the time intel measures?? hey, we are getting there, relax. If you are an avid reader of this blog you might remember another blog post which introduces a c# script to do what we just need now, create measures well formatted measures using a calculation group! I will not go into the details because I did already on that blog post, but the thing is that we will end up with 4 tidy display folders each containing all the time intel measures.
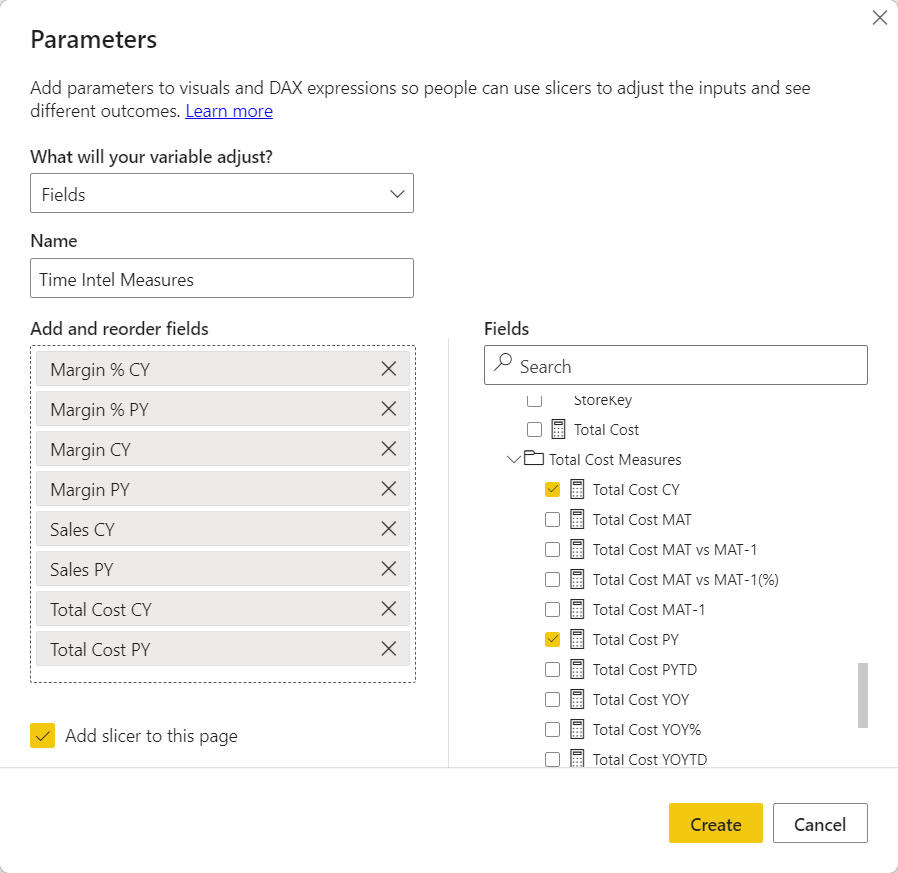
And now comes the tricky part. We want to generate a Field Parameter containing all these measures, and two extra columns, one with the base measure name, and one with the calculation name. We’ll do this first by hand, see if we get the desired effect and then see if we can automate even more the process somehow. Since we are just testing, I’ll manually create the field parameter with a couple calculations for each measure CY and PY. Before that I’ll have to save changes back to the model of course.
Since I’m not super-familiar with field parameters and I want to change a few things, I decided to first put a chart as it came out to make sure that everything works as expected. Then if I break it somewhere down the path I’ll know where the problem is. So I have a regular chart with a field parameter.
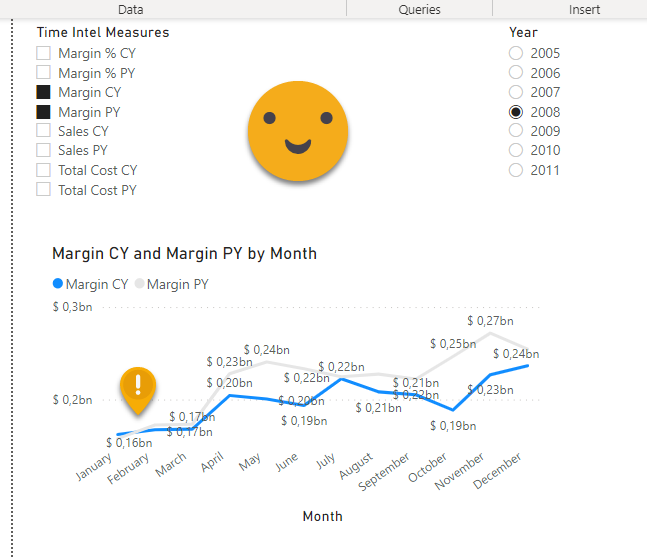
I saw that previous year is on top, but that has to do in the order I selected the values of the field parameter — hopefully if they get selected simulaneously through a filter they will keep the original order. We'll see. Anyway, now we need two columns in our field parameter table, one for the base measure name and one for the calculation. I can add two calculated columns or I can modify the field parameter table expression… I'll try to modify the field parameter expression as this will be way easier to automate later — I think. Or at least more elegant. I don't want to put a huge Switch on the calculated columns.
Well it seems to work! We get a dynamic legend and we can choose the measure, and well we could also choose the calculation (or calculation pairs!) if we added more measures into the field parameter — I'm not lazy… we'll maybe I am. As a side note, I realize that the lowest measure in the field parameter appears right in the legend and on top when the lines cross. Good to know if that becomes a problem. For now let's try to automate this thing a bit more.
The idea is to extend the code of the script that generates measures with a calculation group so that in the end it creates a field parameter with the extra columns of the base measure name and the calculation item name. The bit regarding the creation of the field parameter I will shamelessly copy from what no other than Danliel Otikyer posted like the very same day that Field Parameters went live and people where still discussing what makes a calculated table actually a field parameter beyond the DAX expression.
I’ve been looking intensely on the code, particularly on the bit that creates the DAX expression which is what I want to modify
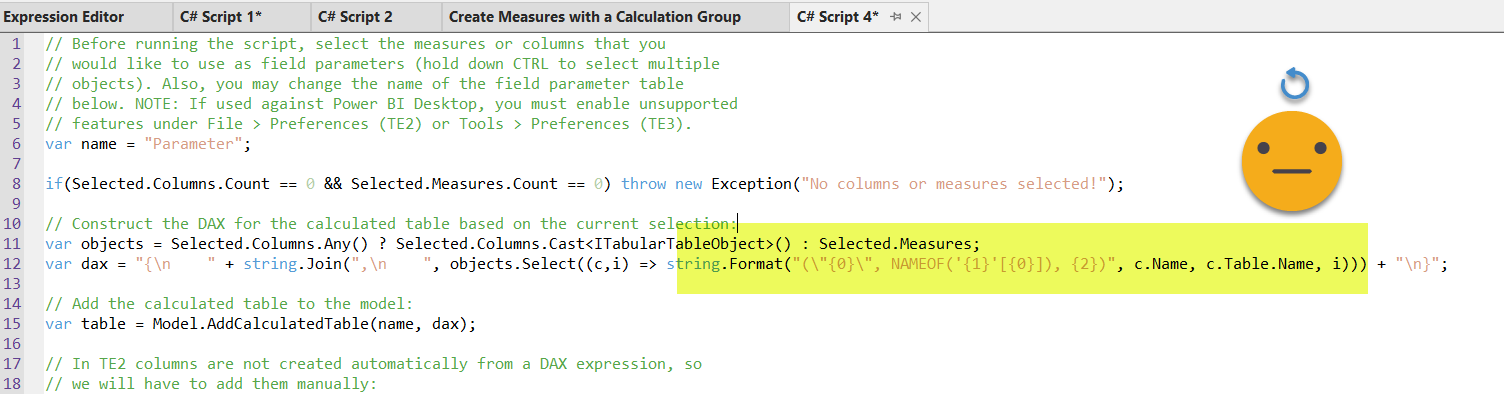
As you can see it creates the expression in one go, which is awesome, but also makes it a bit more difficult if you want to intercede somehow. As a pragmatic engineer more than a programmer, I decided to somehow stick the metadata we need to each of the created time intel measures, so that when this script is run it can go and find it for each of the measures. It is a specific use of the field parameter script so I’ll just toss it together with the script to create the well formatted measures. And then I’ll try to put a question so that the field parameter is built only if the user answers yes during run-time.
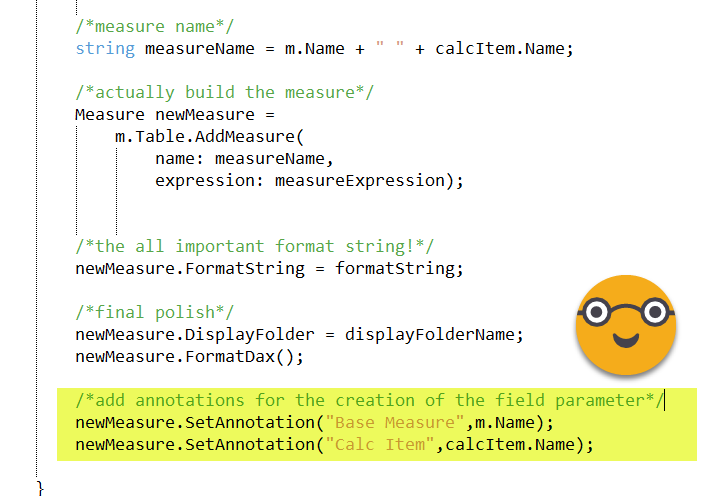
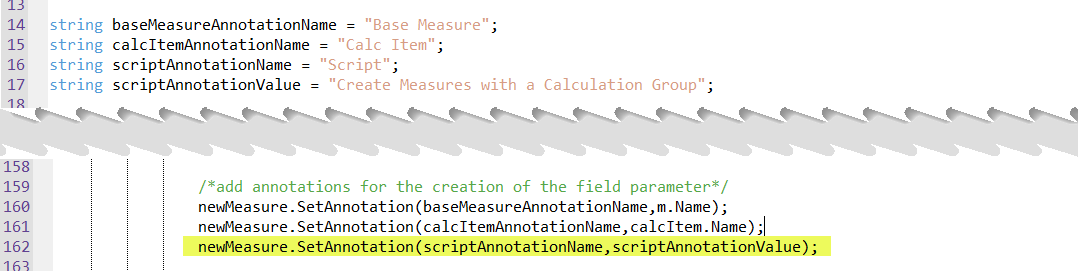
There’s a great place to add metadata — and that’s the annotations! I think you have to enable unsupported actions to be able to see them when working with PBIX but I haven’t faced any issues so far with that (no warranties!). So we need to modify the original script so that an anotation tag «Base Measure» and another one «Calculation Item» are added. That’s easier than it sounds.
Now of course we need to use these annotations while building the dax expression for the Field Parameter table. The String.Format function accepts like a string structure with some placeholders ({0},{1},{2}… ) and then aftwerwards you provide the values for the placeholders in order. So I added a couple more placeholders and a couple more arguments to Daniel’s code!
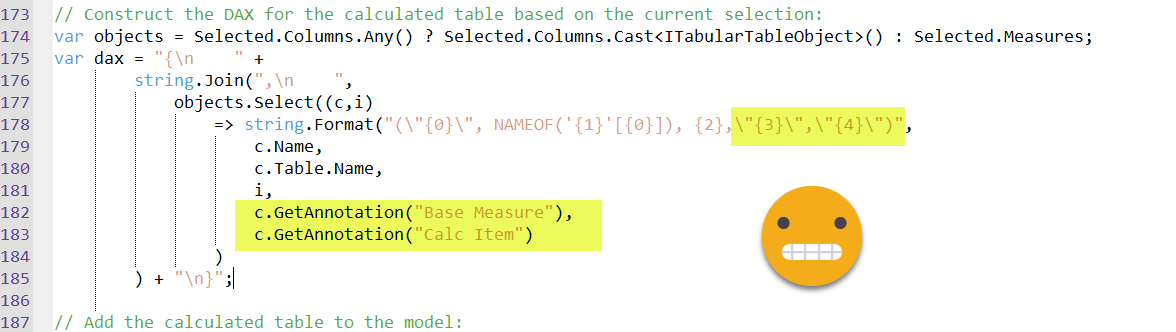
Of course this code will fail if run with measures that do not have such annotations but since we’ll run together we’ll be fine.
And then I run it and…
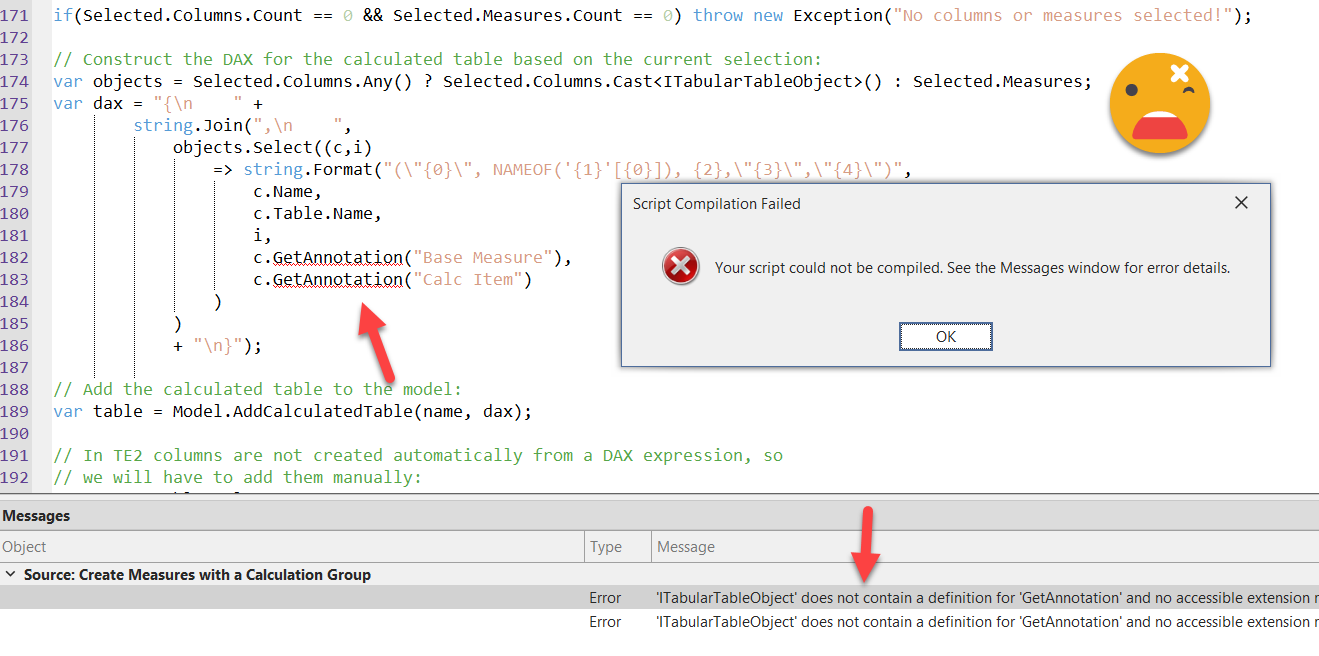
«Error ‘ITabularTableObject’ does not contain a definition for ‘GetAnnotation’ and no accessible extension method ‘GetAnnotation’ accepting a first argument of type ‘ITabularTableObject’ could be found (are you missing a using directive or an assembly reference?) »
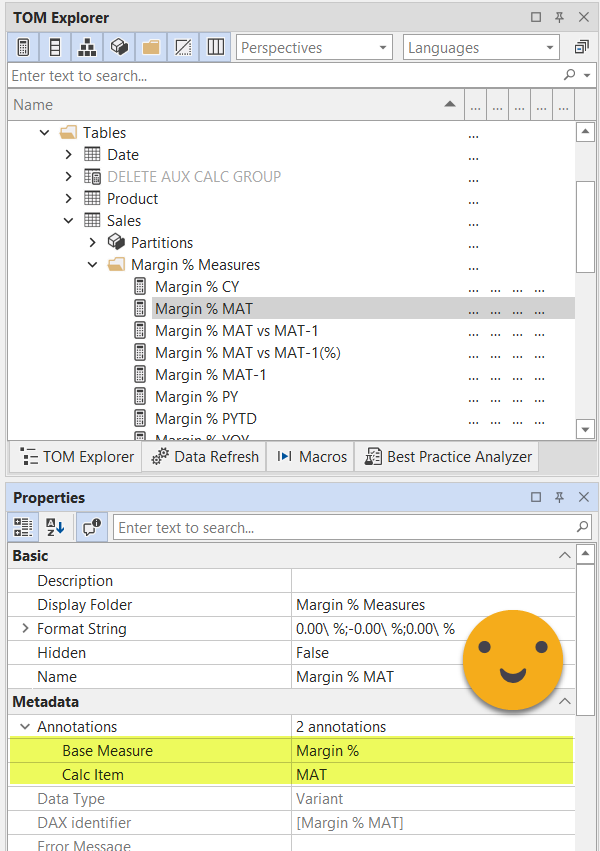
Wait, what?! Hmmm…. It did not break for «Set Annotation» so measures do have annotations right? Right? Well to be extra-sure I commented all the part from Daniel and run my modified script to create measures with a calculation group. And indeed the annotations are there.
I’m not a TOM gurú, but the line that makes a CAST as Tabular Object Model seems to be the culprit. It the object is treated as a higher level object, maybe it does not have all the methods and properties available. Tabular Object probably can be just about anything so it’s likely that you don’t get to access annotations. You can see the name, table name but not much more. I guess. But hey, if I have the name of a measure I can go and pick it up again from the model as a measure with all the metadata luxury I need. Maybe I can cast it back to a measure too? well maybe but I’m not sure how to do that, so I’ll just go with the former approach. It ain’t pretty, but if it works, it works.
after a while of getting weird errors and going back to Daniel’s expression I found a way
Model.Tables[c.Table.Name].Measures[c.Name].GetAnnotation("Base Measure"),
Model.Tables[c.Table.Name].Measures[c.Name].GetAnnotation("Calc Item")
Trying to jump directly by Model.AllMeasures does not quite work. Not completely sure why. But there’s something else. And it’s a bit embarrassing. After while of troubleshooting the code I realized one basic thing. The selected measures are the base measures — and I want to create the field parameter with the Time Intel Measures! Oups. Back to the drawing board. I need to either programatically select the new measures (and unselect the base ones) or build a list/array of measures that can replace the «objects» variable. I mean I could build the whole dax expression as well in a less fancy way as I create the measures but let’s see if can reuse Daniel’s code by initializing the variable objects differently.
Hmmm… I tried to build a MeasureCollection without any success. There is no Add method, or append, and the InternalAdd method is private so you cannot access it. Let’s think again. Well, something that I use a lot is selecting items from the model based on the annotations. I do that to see if a calculation group is already in place for instance (whatever the name it has). So I figured out that this approach could work. I just needed an annotation for all the created measures so that I could select them easily with a LINQ expression (more on that in a second). I thought that it would be cool to add a script name annotation that would easily identify all the measures created by the script. So that’s what I did. I may add other annotations with the URL etc, we’ll see. And the good thing is that the approach worked!! While I was at it I replaced the hard coded annotation names with variables that are initizalized at the top of the script if anyone wishes to change them.
And then Daniel’s code stays mostly the same with a small difference
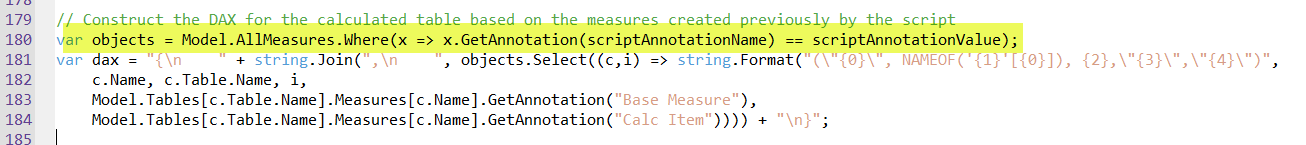
This is the LINQ expression I was talking about earlier. It feels weird but once you get used they are very convenient, just remember they start with that x => and in the expression afterwards each of the elements are now the x so you can access any property of it and put some logic to filter all the elements. All those that comply are returned as a collection, and from there you can do things with it. Google it up, it’s not something specific of TOM is there in c# since like forever.
Well, anyway, the good thing about the LINQ expression is… that it works!
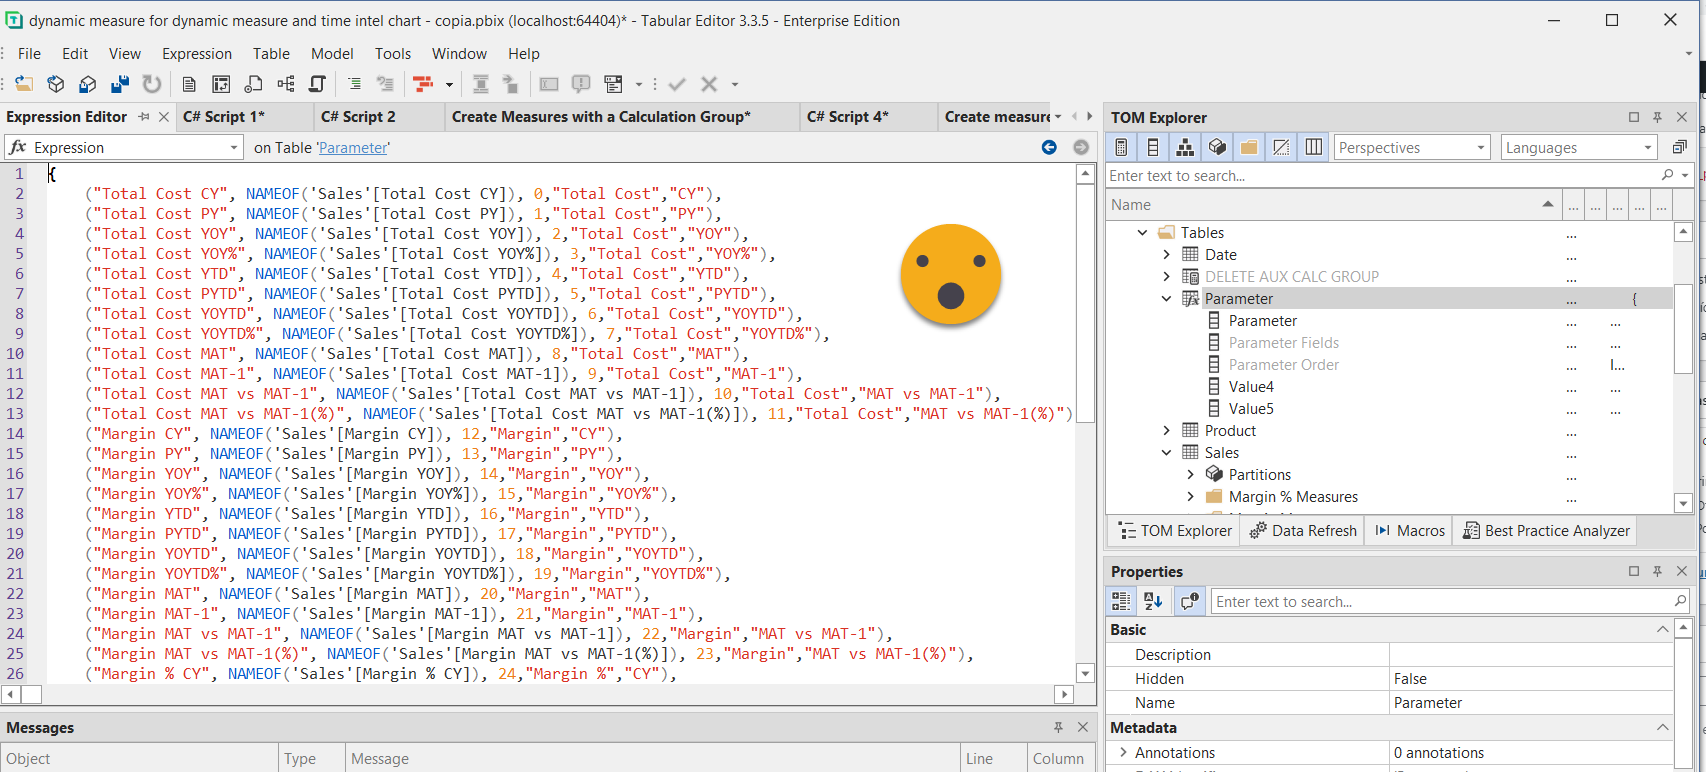
Well, not only creates the expression, it actually works for real when we save back to the model! (Remember that creating field parameters since they are a sort of calculated table this requires unsupported actions enabled, but again, pretty safe)
Once we reached this point it's hard to resist to add one extra table to create pairs of calculations that make sense to see together… so I created a table like this
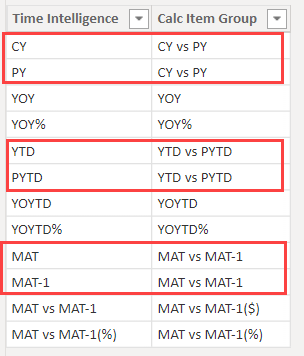
Then I created a relationship in the model between the Time Intelligence column and the Value5 column of the field parameter
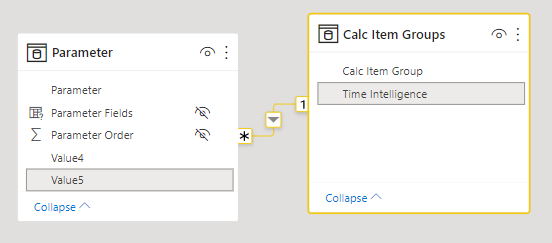
So in some cases it makes sense to pick a single base masure and check two calculations, in other cases pick two measures and a single calculation — your choice! in any case the legend will adapt
And that's pretty much it!
Now I will add the ability to choose the field parameter name and we are good to go!
you want to have a look at the script? here it is!
you want to have a look at the pbix? knock yoursef out!
Thank you for bearing with me until the end 😀