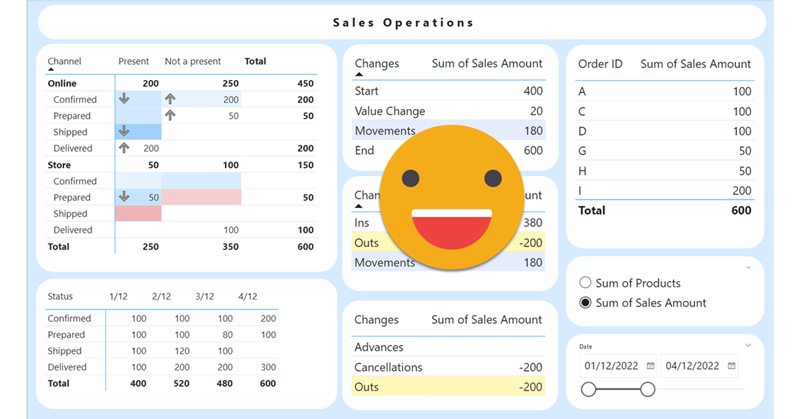
Hello there, yes, a third part of the snapshot report and I’m not even sure it’s the last one. The thing is that since the last post there has been some major improvements on the set up that I thought are worth sharing. In my previous post I ended up with a small defeat. There were some combinations of filters that when I drilled through to see all the historic records of those order IDs I would not get any rows. Also my set up included duplicating the fact table which is a big no-no in most use cases and a shameful solution from a modeler perspective. Even though this was the best I had, I decided to present the topic on two events, one was the Data Community Day Austria 2023 and the other was @PowerBIEspanol Virtual Conf 2023 (Fin Tour Power BI Days), just a few days apart. The fact that I had to present the solution to a lot of people kept me thinking and looking for solutions, so with the help of the always reliable Ricardo Rincón I finally found out a working solution just duplicating dimension tables and creating dimension tables for everything (even comments and stuff like that). That was much better but not quite scalable. In real life things are ugly and tables have many columns. So while fighting with the same use case at work, I found a sneakier and much better solution that got rid of all those superfluous dimension tables reducing the need of them to just 2. While preparing the presentations I also worked a bit on the report layer and I’ll also share some techniques I came up with that can be helpful at some point. But enough of all this talking, let’s do what? Let’s get to it.
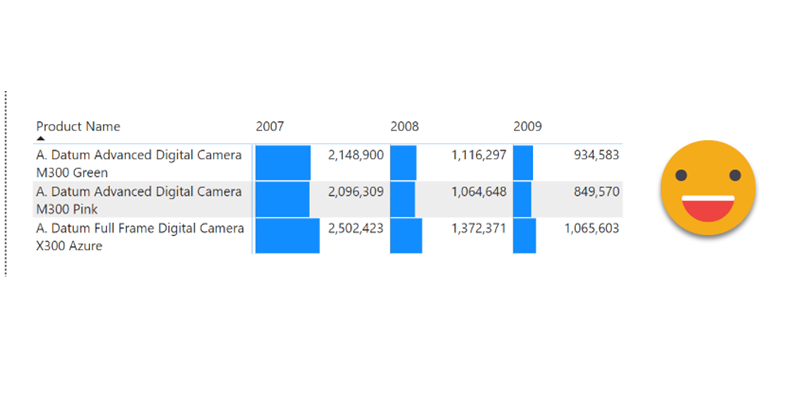
Ok, this is one of those things that I might not do in production unless I have the CEO shouting on my ear «I want the bars of the matrix to be smaller so I can read the numbers, and no, you may not use a custom visual for that!». I know that might be quite a narrow use case, but hey, if the CEO wants it, so be it.
I’ve been meaning to write this post for quite a few weeks if not months, and looks like today I may start finally to do it. The detonator has been that I had to do it at work, and Yuki asked about it on twitter. Too much of a coincidence to let it go.
Conditional formatting when calc groups are involved is a bit more challenging, but as usual with calc groups, once you grasp how they work you can do almost anything you want with it.
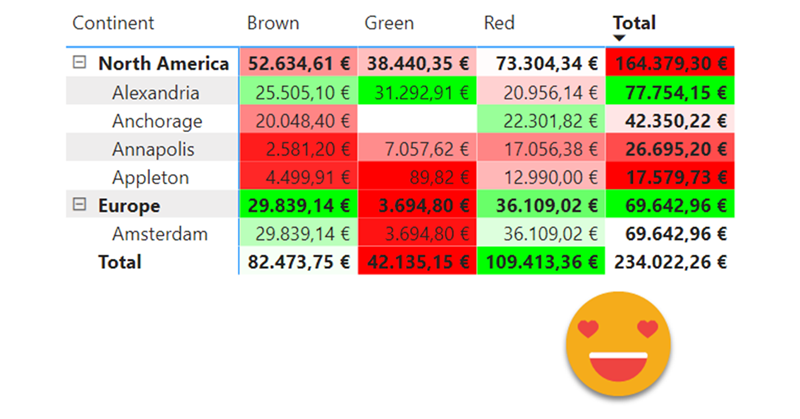
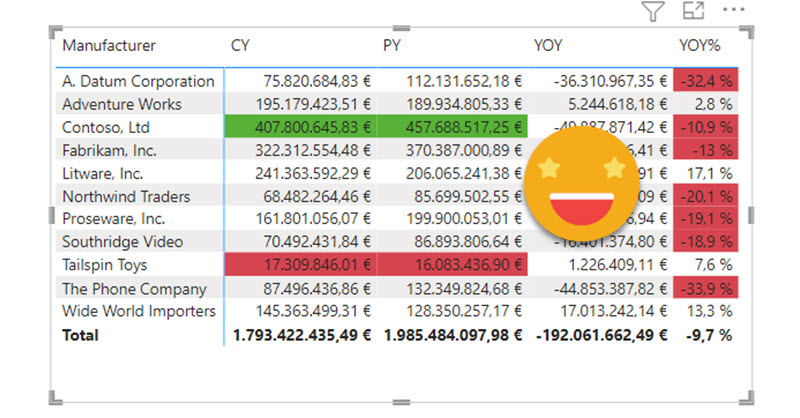
It’s a loooong title (well, it was «Conditional Formatting with divergent color gradient for values and totals»), but it’s exactly what I wanted to achieve when I discovered the limitations of the conditional formatting options in the GUI of Power BI Desktop. The key words are «dynamic» in one hand and «values and totals in the other» I know, some of you may think I’ll be doing some copy-cat article of the crazy video from Bas in which he shows how to use the undocumented (that I know of) function hsla(). A function that you need to leave as text?!? Crazy, just crazy. But no, I take a complete different approach and I think it’s worth the effort! Of course you can take ideas from both me and Bas and come up with your own unique approach for dynamic conditional formatting.
Ok, this is a rather niche use case, but I’ll go ahead anyway, basically because I think it’s cool.
In conditional formatting in Power BI you have three options: By values, by rules and by measure. In this last case, you have to provide a measure which provides a hexadecimal code, such as #FFFFFF for white and so on. When I saw this option I liked it because you can write the most twisted logic of the world and format according to that, but I felt uneasy about the fact that you have to hardcode the hexadecimal codes in the DAX logic. WHAT IF YOU DECIDE TO CHANGE THE THEME OF YOUR REPORT??