Theme-compliant conditional formatting measures
Ok, this is a rather niche use case, but I’ll go ahead anyway, basically because I think it’s cool.
In conditional formatting in Power BI you have three options: By values, by rules and by measure. In this last case, you have to provide a measure which provides a hexadecimal code, such as #FFFFFF for white and so on. When I saw this option I liked it because you can write the most twisted logic of the world and format according to that, but I felt uneasy about the fact that you have to hardcode the hexadecimal codes in the DAX logic. WHAT IF YOU DECIDE TO CHANGE THE THEME OF YOUR REPORT??
I would love it if you could refer by some expression to the theme colors, so then when you change the theme, your measure-based conditional formatting changes accordingly, but there’s no native way that I know of. So I thought of the best workaround to get something close to that.
Update 2021-05-07: If you are here to grab the link to the repository jump to the very end of this post and you’ll find it.
It was watching Reid‘s chat with Mark Carlo (go watch it if you haven’t) that I learned about powerbi.tips and it’s theme designer, and the fact that it builds the json that is the theme anyway. So the theme is a json. And Power Query can read from json files. So if I export my theme, I could get to the colors and so on. Well, not so fast. By default you have to change something to have your «custom theme», but if you then export it, it does not export the whole, thing, just the little thing you changed. All I wanted really was a json with the default theme (to start with), but I had to trick Power BI into thinking that I had changed it. So basically I changed the colors, and changed them back to their original values, and voilà, they would show up in my exported theme file. Great. I show here only dataColors and sentiment colors, but if you dabble with background and so on you also get them, a bit deeper into the json tree, though.
{
   "name":"Custom",
   "dataColors":[
     "#118DFF",
     "#12239E",
     "#E66C37",
     "#6B007B",
     "#E044A7",
     "#744EC2",
     "#D9B300",
     "#D64550"
  ],
  "bad":"#D64554",
  "good":"#1AAB40",
  "neutral":"#D9B300"
}
Next step was building a dataflow that would transform this json file into a Color Table so to say, one column for color name, one column for color code. I put the file in a sharepoint and got on to it. Eventually I managed to get what I wanted: (The steps are not difficult but lengthy, that’s why I didn’t add them here, ping me if you are interested. )
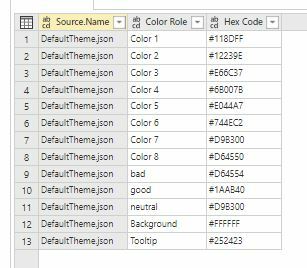
So now I had a table I could load to any Power BI, but I didn’t have my measures, yet. I wanted to be able to say [background] and get «#FFFFFF» (or rather the color defined as such in the json file). I could type each of the measures by hand, but this didn’t look very efficient (as Patrick Leblanc says, I’m not lazy, I’m just really efficent), especially as I was thinking on making it part of the corporate template Mike Carlo talked about in the interview with Reid. So I turned my attention to Tabular Editor, from which I knew you could (besides calculation groups of course!) make scripting to modify the model. It took me quite a few tries and errors, but got what wanted: creating all those measures with a single click!
UPDATE 2021-05-07: I Improved the previous script, and now it creates dynamically all the measures for the colors you have defined in your color table, be it 6, 10, or 40. I totally used Darren Gosbell’s script from this page as a base. At the end of the article you’ll find the link to the repository where you’ll find the script.
You just need to select the color table in the model and execute the following code:
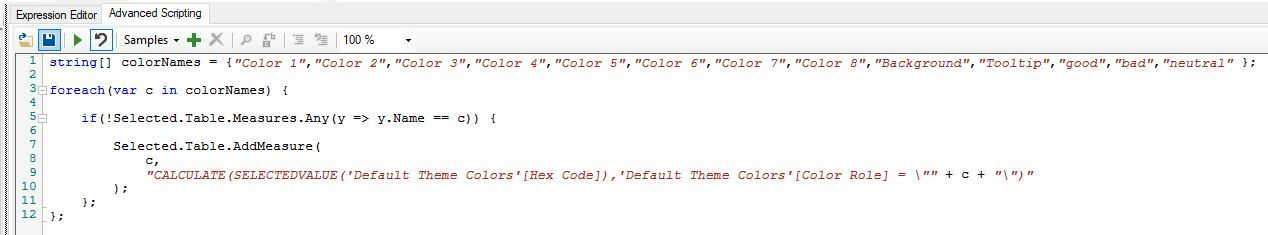
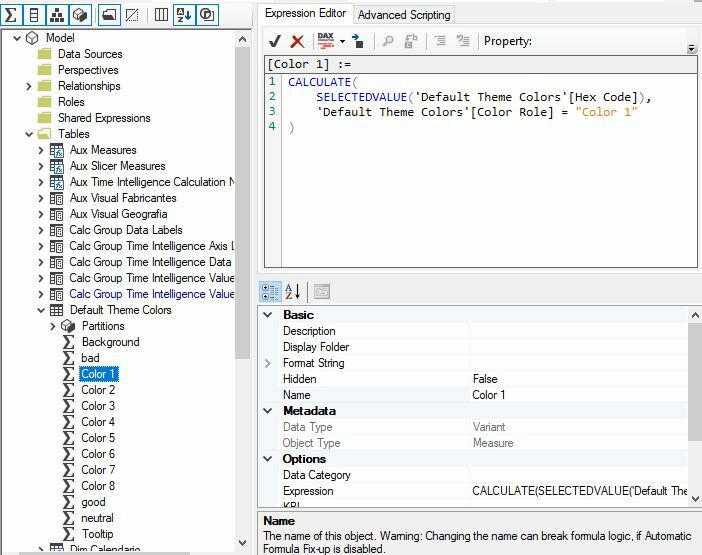
and voilà the measures are there! (full disclosure: I did format them for the picture!) –> UPDATE 2021-05-07 the new scripts preformats the code with the daxformatter api
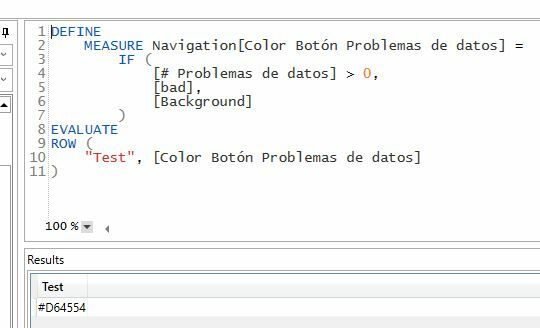
Now I could make a button to show problems with data, but only when there are problems with data. Otherwise it just blends into the background color, whatever this color is. For details on how to make such a button just watch Patrick the only thing different in my case is that the color of the button measure has this format now:
DEFINE
    MEASURE Navigation[Color Botón Problemas de datos] =
        IF ( [# Problemas de datos] > 0, [bad], [Background] )
EVALUATE
ROW ( "Test", [Color Botón Problemas de datos] )
and it does work:
Cool huh? Well. It’s a lot of work for just one report, but if your are developing a corporate template, it might be worth a try.
UPDATE 2021-05-07: The new script creates the measures ensuring it is a string at the end, because otherwise Power BI does not recognize them as valid hex-color measures in some contexts and cannot be selected. This is achieved using FORMAT( … , @) which returns the text as text. Weird, but power bi does not know what can come out of a calculate, but it does know that from FORMAT function it always comes a STRING.
Important note, if you define your custom theme you should start with a faux custom theme like the one I described, so that power query finds all the codes it needs, not just the ones you changed. Then, you update your custom theme, export it as json file and replace the source file from which you are reading to get your color table.
While we are at it, go check GreySkull Analytics video on how to include a background image as part of your custom theme, pretty awesome!
Repository link: