Normalizing conditional formatting bars

Ok, this is one of those things that I might not do in production unless I have the CEO shouting on my ear «I want the bars of the matrix to be smaller so I can read the numbers, and no, you may not use a custom visual for that!». I know that might be quite a narrow use case, but hey, if the CEO wants it, so be it.
It is true that contitional formatting is quite poor when using bars, because you cannot use a separate measure for the value, nor can you define a dynamic max value. You have to either pick the maximum value of the measure (ensuring that a number will be completely covered by a bar) or a hardcoded maximum value which may make no sense depending on your filter selections. This is indeed underwhelming so we had some discussion on twitter with Jeff Weir on how it could be done (before PBI desktop ups its native visualizing game). The final solution that we agreed that could work, is not elegant, it’s dirty, but here I’ll discuss a bit how it would go. At the end you may not even realize how dirty it is.
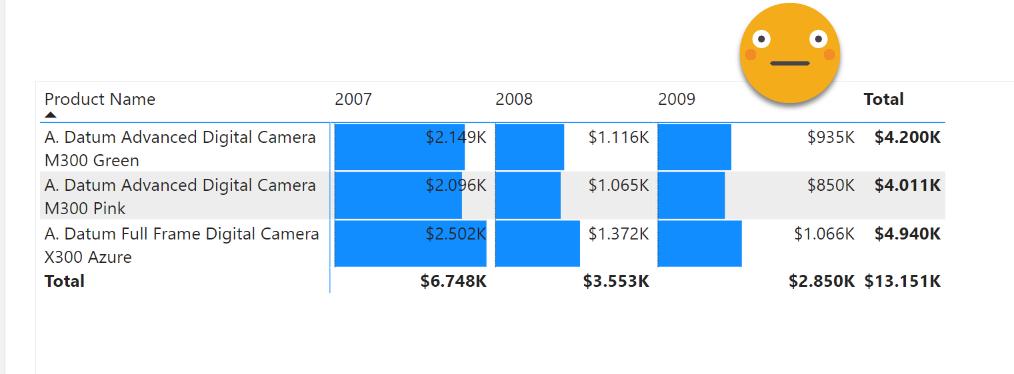
The starting point is a regular matrix where I’m showing 3 products and their sales amount in three different years. Indeed is not easy to read because bars overlap numbers, even though there’s plenty of space for both.
The only way we can limit the length of the bars is by declaring a hard-coded max value, otherwise the higest value of the measure will pick the full width of the cell. Thus, the measure must take certain fraction from this arbitary number we pick. Let’s say we want the longest bar to be 50% of the width of the cell, we’ll need to normalize the maximum value to 0.5 in case the maximum value we defined for the bars is 1. Or even better, we’ll just normalize the values agains the maximum so that the maximum value gets value 1 and then we define the max bar value to be 2. This will make calculations easier.
Unfortunately we can not do this dynamically, we’ll have to do it for the combination of dimensions we are using in the visual.
Sales Normalized =
VAR currentValue = [Sales]
VAR maxValue =
    CALCULATE (
        MAXX (
            CROSSJOIN (
                VALUES ( 'Product'[Product Name] ),
                VALUES ( 'Date'[Year] )
            ),
            [Sales]
        ),
        ALLSELECTED ( 'Product'[Product Name] ),
        ALLSELECTED ( 'Date'[Year] )
    )
VAR normalizedSales =
    DIVIDE ( currentValue, maxValue )
RETURN
    IF (
        currentValue <> BLANK (),
        normalizedSales
    )
And throwing it in the matrix seems to produce accurate results. I turned it into a percent measure and hid the totals.
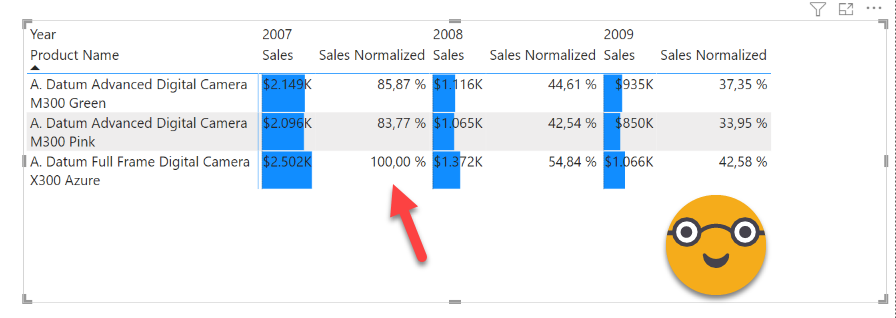
So far so good, but now what? As stated earlier, we cannot specify a different measure to draw the bars, but be the same measure from the values! Oh well, first we’ll get the bars right, then we’ll worry about the values.
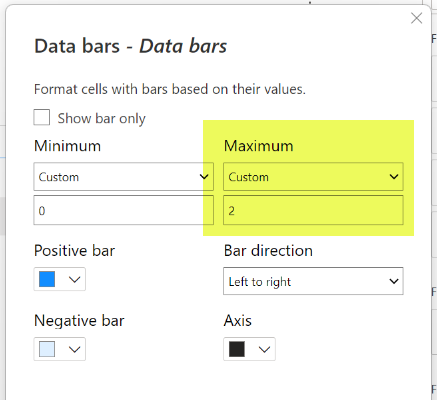
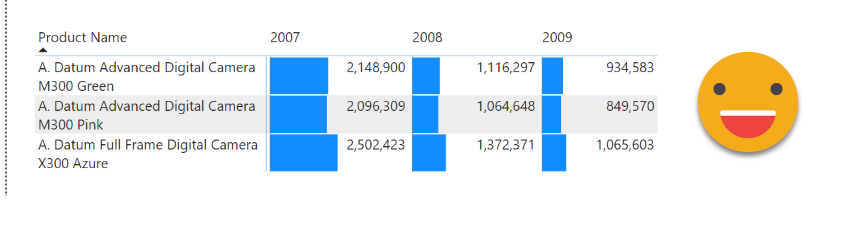
We remove the Sale measure and we add bar conditional formatting on the Sales Normalized measure. For Maximum we’ll specify 2. Oddly enough, even though minimum is set to take the lowest value that’s not quite true, as then one bar would be completely nonexistent. Indeed puting a 0 as custom minimum value reults in the exact result, so well, who knows what is going on inside.
And here’s the result
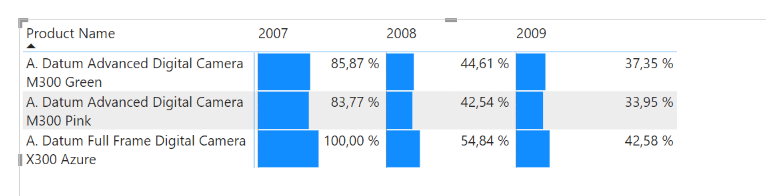
Ok, we do have shorter bars now, but hey, what about the numbers?? Well, there’s no elegant way out of it, but there is one trick that always works…. calculation groups! With them we can show anything as an arbitrary string inside of the format string. I told you is not elegant, but if it works, it works.
The calculation group itself is quite straightforward. Do we want to change the value that is being used? No, because we want the bars just as they are, so we’ll use SELECTEDMEASURE(). Do we want to change the value that is being displayed? Yes, we want to change it for entirely someting else. Then we’ll put whatever we want to show, «protected» with single quotes. Yes! in the past I’ve shown you can do that with double double quotes but it turns out you can use single quotes instead and works just as fine, and it’s much easier to see. Kudos to Pedro Gravanita for letting me know. Anyway, here’s the calc group
------------------------------
-- Calculation Group: 'Labels'
------------------------------
CALCULATIONGROUP 'Labels'[Labels]

    CALCULATIONITEM "Show Sales Values" =
        SELECTEDMEASURE ()
        FormatString = "'" & FORMAT ( [Sales], "#,##0" ) & "'"
Notice we use a sales measure but then we format and we «protect» it so that it will be shown «as is» and will not be interpreted as a regular format string. So now we save the measures back to the model and apply the calculation item at the visual level and …
it works!
can you say if its an actual value or something put through artibrary format string? No, you can’t, but you may think: «Yeah sure, but certainly if someone exports the data will be utterly confulsed». Well, think again — this is what comes out if you export as csv:
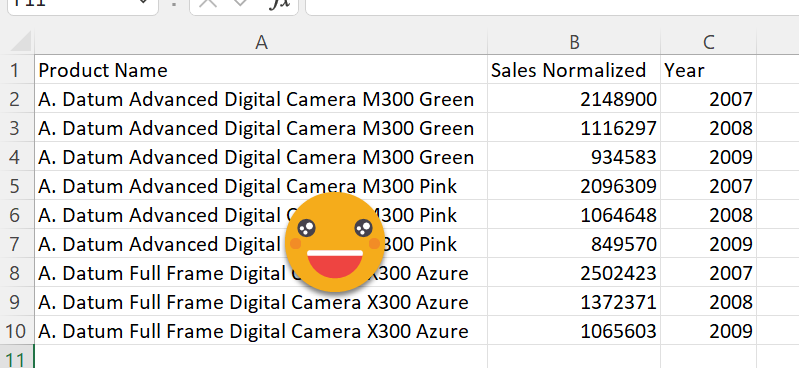
That’s pretty crazy don’t you think? I wasn’t quite sure what would happen to be honest. So well, if it works, it works. No, I haven’t tested on a huge table, but huge tables should not be part of a report anyway, right? Well, unless the CEO asks for it of course. So I will not say it d——s but you know what I mean.
Want to play with the file? Be my guest. Normalizing conditional formatting bars is not impossible, but is not easy either.
Thanks for reading and well, use it if you have to — take care!