Comparing arbitrary date ranges in Power BI

Hello there!
Today’s post comes from an actual requirement that I had heard before but never handled directly. There is some nifty DAX and modeling so lets get to it!
(at the very end you will find a script to achieve the end result with no effort! but don't be greedy and read along to know what you are doing)
To compare two arbitrary periods you first need to be able to define them, and for that you need, well, two different date tables. It makes things easier and remember, periods could be overlapping if you want to. When we say comparing, we mean getting one value, getting the other, calculating the difference and the porcentual difference. Then of course, there will be different measures you want to compare. You know where this is going. We need a calculation group!
But before we get into the details, see the final result! You can see how many days (and weekdays) you are selecting in each period (selection or comparison). As with anything in power bi you can check out the aggregated values and then cross-filter to see the detail. And like any calc group, you can just swap the measure and it all still works. Sweet, isn't it?
So how did I do this?
First remember, two date tables. One is called 'Date' and the other one is 'Date comparison' and it just a replica of 'Date'. Both are defined as date tables, and have their months and weekdays sorted correctly. Oh and they are both connected to the Sales table.
Also in order to count the days selected we will create a couple of measures
---------------------------
-- Measure: [Days Selected]
---------------------------
MEASURE 'Date'[Days Selected] =
    COUNTROWS ( 'Date' )
    Description = "This measure is number of rows of Date"
    FormatString = "#,##0"

---------------------------------
-- Measure: [Days Comparison]
---------------------------------
MEASURE 'Date Comparison'[Days Comparison] =
    COUNTROWS ( 'Date Comparison' )
    Description = "This measure is number of rows of Date Comparison"
    FormatString = "#,##0"
Then this might be the way you build your calculation group, and it would be almost perfect:
-----------------------------
-- Calculation Group: 'Model'
-----------------------------
CALCULATIONGROUP 'Model'[Model]

    CALCULATIONITEM "Selection" =
        CALCULATE (
            SELECTEDMEASURE (),
            REMOVEFILTERS ( 'Date Comparison' )
        )
        Ordinal = 0

    CALCULATIONITEM "Reference" =
        CALCULATE (
            SELECTEDMEASURE (),
            REMOVEFILTERS ( 'Date' )
        )
        Ordinal = 1

    CALCULATIONITEM "Comparison" =
        VAR _selection =
            CALCULATE (
                SELECTEDMEASURE (),
                REMOVEFILTERS ( 'Date Comparison' )
            )
        VAR _refrence =
            CALCULATE (
                SELECTEDMEASURE (),
                REMOVEFILTERS ( 'Date' )
            )
        VAR _result =
            IF (
                ISBLANK ( _selection )
                    || ISBLANK ( _refrence ),
                BLANK (),
                _selection - _refrence
            )
        RETURN
            _result
        FormatString =
        VAR _fs =
            SELECTEDMEASUREFORMATSTRING ()
        RETURN
            "+" & _fs & ";-" & _fs & ";-"
        Ordinal = 2

    CALCULATIONITEM "Comparison %" =
        VAR _selection =
            CALCULATE (
                SELECTEDMEASURE (),
                REMOVEFILTERS ( 'Date Comparison' )
            )
        VAR _refrence =
            CALCULATE (
                SELECTEDMEASURE (),
                REMOVEFILTERS ( 'Date' )
            )
        VAR _result =
            IF (
                ISBLANK ( _selection )
                    || ISBLANK ( _refrence ),
                BLANK (),
                DIVIDE (
                    _selection - _refrence,
                    _refrence
                )
            )
        RETURN
            _result
        FormatString = "+0 %;-0 %;-"
        Ordinal = 3
Basically, when it calculates the value for the «selected» period, it must remove the filter coming from the comparison period, and viceversa. To calculate the absolute and porcentual difference, we repeat the expressions. Remember: Friends don’t let friends do lateral recursion in calc groups. See that for the «Comparison» calc item we reuse the original format string to define the new format string with a + and – sign to make explicit that this is a difference and not an absolute magnitude. In order for this to work properly, make sure that your base measures do not have a complex format string or havoc will break.
This looks all right, doesn’t it?
Well… almost! Look what happens when we see the report…
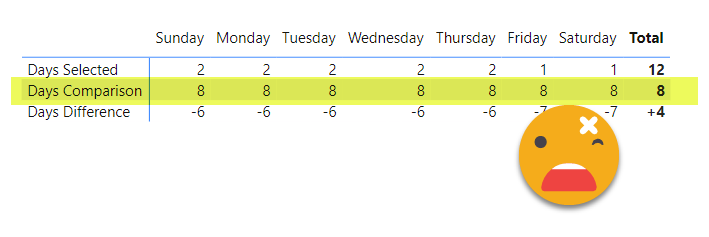
if the question is «what’s wrong?» the answer is… THE FILTER CONTEXT!!
We are using the «Weekday Name» column from the date calendar, and, well, it does not filter the date comparison table. Thus, if we count the rows on the date comparison table, we’ll see the same rows in each data point of the row.
What is to be done??
Well, making a week date table filtering both calendar tables IS NOT an option because there would be two filtering paths between this table and sales table.
If you have watched enough SQLBI videos, you might know that TREATAS is your friend here. Basically we need to move the filter coming from the date table onto the date comparison table. If we just cared about the «Days comparison» measure, we could rewrite it as
MEASURE 'Date Comparison'[Days Comparison] =
    CALCULATE (
        COUNTROWS ( 'Date Comparison' ),
        TREATAS (
            VALUES ( 'Date'[Day of Week] ),
            'Date Comparison'[Day of Week]
        )
    )
However if we look carefully at the second table, we’ll see we also have a problem there…
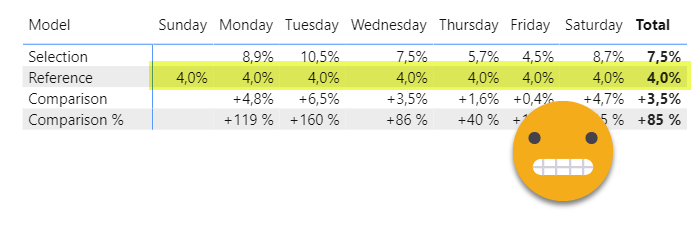
So we need to do *something* at our reference Calc Item… but what? we are already getting rid of the filter coming from date!
CALCULATIONGROUP 'Model'[Model]
   ...
    CALCULATIONITEM "Reference" =
        CALCULATE (
            SELECTEDMEASURE (),
            REMOVEFILTERS ( 'Date' )
        )
Well, what if we move the filter coming from ‘Date’ before we get rid of it?
CALCULATIONGROUP 'Model'[Model]
    ...
    CALCULATIONITEM "Reference" =
        CALCULATE (
            CALCULATE (
                SELECTEDMEASURE (),
                REMOVEFILTERS ( 'Date' )
            ),
            TREATAS (
                VALUES ( 'Date'[Day of Week] ),
                'Date Comparison'[Day of Week]
            )
        )
I’m not 100% if we need to nest the two calculates, but at any rate it makes it easier to understand, and guess what, it works! Of course we need to replicate the logic in the comparison and comparison % calc items. This is how the calc group looks now:
-----------------------------
-- Calculation Group: 'Model'
-----------------------------
CALCULATIONGROUP 'Model'[Model]

    CALCULATIONITEM "Selection" =
        CALCULATE (
            SELECTEDMEASURE (),
            REMOVEFILTERS ( 'Date Comparison' )
        )
        Ordinal = 0

    CALCULATIONITEM "Reference" =
        CALCULATE (
            CALCULATE (
                SELECTEDMEASURE (),
                REMOVEFILTERS ( 'Date' )
            ),
            TREATAS (
                VALUES ( 'Date'[Day of Week] ),
                'Date Comparison'[Day of Week]
            )
        )
        Ordinal = 1

    CALCULATIONITEM "Comparison" =
        VAR _selection =
            CALCULATE (
                SELECTEDMEASURE (),
                REMOVEFILTERS ( 'Date Comparison' )
            )
        VAR _refrence =
            CALCULATE (
                CALCULATE (
                    SELECTEDMEASURE (),
                    REMOVEFILTERS ( 'Date' )
                ),
                TREATAS (
                    VALUES ( 'Date'[Day of Week] ),
                    'Date Comparison'[Day of Week]
                )
            )
        VAR _result =
            IF (
                ISBLANK ( _selection )
                    || ISBLANK ( _refrence ),
                BLANK (),
                _selection - _refrence
            )
        RETURN
            _result
        FormatString =
        VAR _fs =
            SELECTEDMEASUREFORMATSTRING ()
        RETURN
            "+" & _fs & ";-" & _fs & ";-"
        Ordinal = 2

    CALCULATIONITEM "Comparison %" =
        VAR _selection =
            CALCULATE (
                SELECTEDMEASURE (),
                REMOVEFILTERS ( 'Date Comparison' )
            )
        VAR _refrence =
            CALCULATE (
                CALCULATE (
                    SELECTEDMEASURE (),
                    REMOVEFILTERS ( 'Date' )
                ),
                TREATAS (
                    VALUES ( 'Date'[Day of Week] ),
                    'Date Comparison'[Day of Week]
                )
            )
        VAR _result =
            IF (
                ISBLANK ( _selection )
                    || ISBLANK ( _refrence ),
                BLANK (),
                DIVIDE (
                    _selection - _refrence,
                    _refrence
                )
            )
        RETURN
            _result
        FormatString = "+0 %;-0 %;-"
        Ordinal = 3
Of course if you care about other date aggregations like month, or holiday yes/no, or anything else from the date table at all, you can modify the code for that column, or for any of them, replacing the VALUES by SUMMARIZE.
As a matter of fact we can use the calc group to get the correct number of reference days by the day of the week with the following code:
-----------------------------
-- Measure: [Days Comparison]
-----------------------------
MEASURE 'Date Comparison'[Days Comparison] =
    CALCULATE (
        [Days Comparison Raw],
        'Model'[Model] = "Reference"
    )
---------------------------------
-- Measure: [Days Comparison Raw]
---------------------------------
MEASURE 'Date Comparison'[Days Comparison Raw] =
    COUNTROWS ( 'Date Comparison' )
But does it work? You bet it does!!
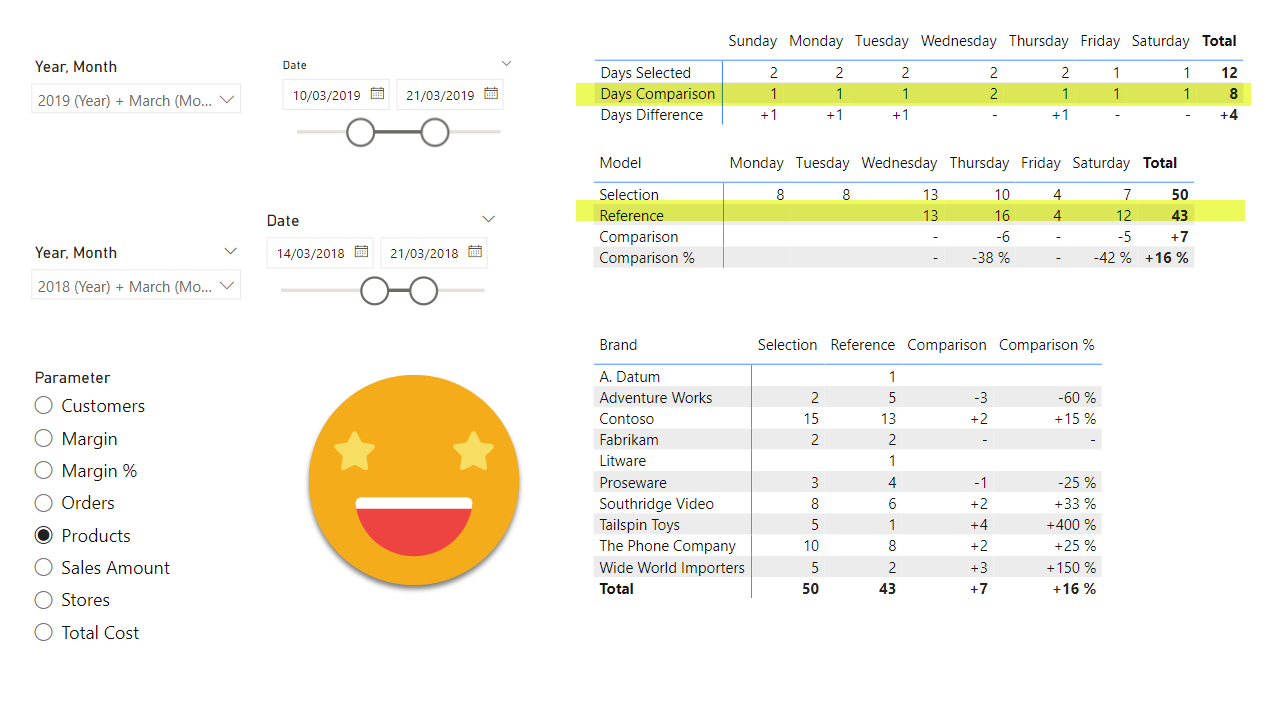
And that’s it!
If you want to play with it, enjoy!
Thanks for reading! follow the conversation on Twitter and LinkedIn
UPDATE (2024-06-02):
I presented this use case in Data Point Prague 2024 (awesome event by the way) and used it as an excuse to show how to use visual studio to author Tabular Editor C# Scripts
- If you only have one date table, first use this script to duplicate it with one click and get all the configuration (and relationships) right.
- Once you have both date tables set up, use this other script to create the calculation group