Hi! actually I was writing another blog post, but today I was shown something that can be done with calc groups that I wasn’t aware of. And not only that, even though the blog post I was shown had some very clever thinking behind, I found there’s still some room for improvement to bring the technique to the next level. We are talking about sorting a matrix by a calculation item placed at the columns section. Let it be said that in many use cases you might be better of just generating the measures with a script (as I showed in this blog post) and using the measures instead. That will give you more control with the UI since each column is indeed a different measure. Yet, there’s something cool in doing things in different way, so I’ll go ahead nevertheless.
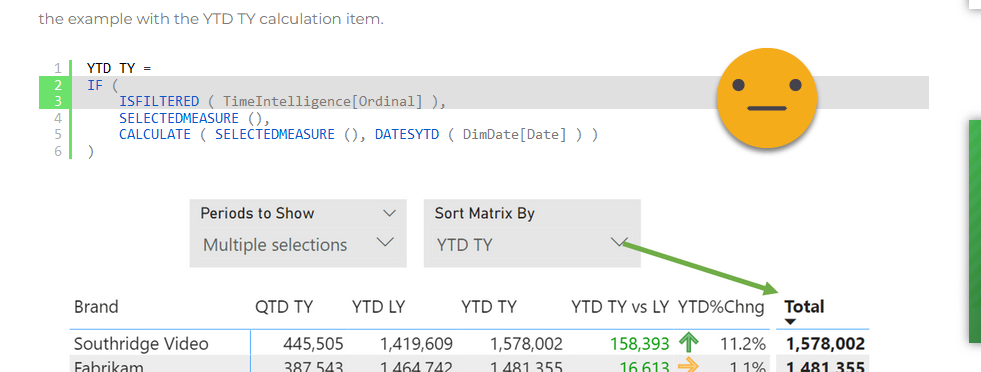
This is the blog post by Kresimir Ledinski. I did not know the blog at all, and apparently is from a company in Croatia. Kudos to David Estapé for showing it to me. Kresimir points out in the blog post that even though we are using calculation items for the columns, there is a now hidden total for columns that we can use to sort the matrix. By default this total will have the value of the measure without any calculation item applied, but with some DAX we can make that total return the value of any of the calculation items and thus effectively sort the rows by the calculation item of our choice. This is brilliant! So why write a blog post about it?
Well, first thing is to let people know this is possible. I wasn’t aware of it until this afternoon and I’m quite into calculation groups, so I reckon plenty of people may not know. And second is to bring some improvements on the technique. In the blog post they rely on the function ISFILTERED to check if the calculation is taking place on the total section or not.

That is very dangerous because this function will also return true at the total level if the calculation items are being filtered as well from the filter panel. The calculation group created by my script has way too many calc items for a single visual so chances are you will be limiting those at the visual level. Thus, ISFILTERED is not the right choice. It only works if you indeed are not filtering the calculation group column in any way. But there’s an easier way to check if you are at the total. HASONEVALUE is just fine.
However there’s also something that I did not like about this solution and that’s the fact that it reproduces the logic of the original calculation item when the calculation is taking place for the total. Calculation groups are all about bringing logic into one place, so it felt weird. Is there a better way? Well, we have to avoid at all costs not applying twice the same calc item or two different calc items from the same calc group simultaneous, but for the total, absolutely no calc item is being applied. Thus, we can apply any one we like without falling into any trap. Since we are just getting the value for sorting we don’t even have to worry about the format string, so a simple calculate with the time intelligence calc group will to the trick.
But how can we choose which calc item do we want to use for sorting? Well, the easiest way I know is to create a calculated table equal to de calculation group, I called it «Time Intelligence Names». That will recreate the name column and order column (actually you need that to sort this new table in the same way), and none of underlying DAX things which we don’t need. With this new table we can create disconnected slicer with all the calculation item names.
Of course we are not going to modify our base measures, so we’ll create a new calculation group, but it will have only a single calculation item. The dax goes like this
----------------------------
-- Calculation Group: 'Sort'
----------------------------
CALCULATIONGROUP 'Sort'[Sort]
    Precedence = 1

    CALCULATIONITEM "Sort" =
        VAR inTotal =
            NOT HASONEVALUE ( 'Time Intelligence'[Time Intelligence] )
        VAR sortBy =
            SELECTEDVALUE ( 'Time Intelligence Names'[Time Intelligence], "CY" )
        VAR result =
            IF (
                inTotal,
                CALCULATE (
                    SELECTEDMEASURE (),
                    'Time Intelligence'[Time Intelligence] = sortBy
                ),
                SELECTEDMEASURE ()
            )
        RETURN
            result
Basically we check if we are at the total row or not with one variable, then we get the calculation item *name* we need to use for sorting from the disconnected slicer, providing a default one if none is selected. And then we do the actual calculation. If we are in the total row, apply the chosen calculation item to the selected measure, otherwise leave things as you found them. And that’s pretty much it.
But does it work?
You bet it does!
There was yet a little thing. What if I wanted to sort by brand?
Well, a little bit by chance I found out that if the sort value is the same for all rows, it will resort to the original order of the field used in the rows section.
Knowing that, we can go now into the original calculation group and add a new calculation item called «No Sort» with an expression equal to 1. Then we go into the «Sort» calculation group and change the default value to «No Sort».
-----------------------------------------
-- Calculation Group: 'Time Intelligence'
-----------------------------------------
CALCULATIONGROUP 'Time Intelligence'[Time Intelligence]
    Precedence = 0

    --[...]
    CALCULATIONITEM "No Sort" = 1
        Ordinal = 21
----------------------------
-- Calculation Group: 'Sort'
----------------------------
CALCULATIONGROUP 'Sort'[Sort]
    Precedence = 1

    CALCULATIONITEM "Sort" =
        VAR inTotal =
            NOT HASONEVALUE ( 'Time Intelligence'[Time Intelligence] )
        VAR sortBy =
            SELECTEDVALUE ( 'Time Intelligence Names'[Time Intelligence], "No Sort" )
        VAR result =
            IF (
                inTotal,
                CALCULATE (
                    SELECTEDMEASURE (),
                    'Time Intelligence'[Time Intelligence] = sortBy
                ),
                SELECTEDMEASURE ()
            )
        RETURN
            result
and voilà!
Of course it would be nicer if we could use the regular UI and click and headers to sort the matrix, like you can in inforiver for instance, but until that day that’s a nifty way to sort a matrix when calculation groups are in place. Having calculation groups instead of measures also have interesting properties. For instance if you have a custom tooltip the tooltip will be affected as well by the calculation item, bringing different insights depending on which column are you looking at. That’s something that will not happen if you use different measures as I was mentioning at the beginning of the post. So as usual, knowledge is power! use it wisely!
If you want to play with the file, here it is!
As usual, follow the conversation on LinkedIn and Twitter!
Regards!!
Epilogue:
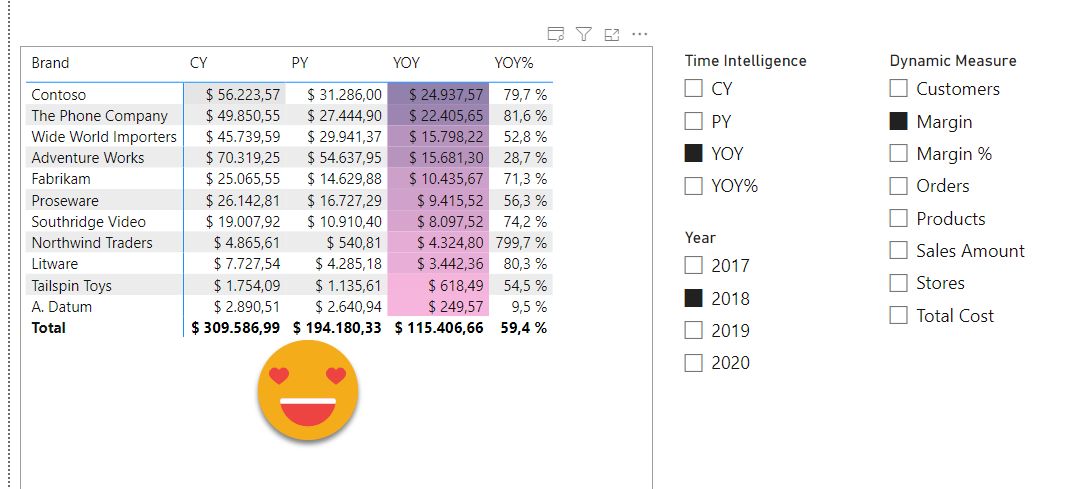
As I was ready to hit publish I thought– Would it be possible to show that the table is actually sorted by certain column? And then I started thinking on conditional formatting and well, I had to give it a try. When calculation groups are involved the easiest way is to have «twin measures» one for the value and one for the conditional formatting. All layers of calculation groups affect both but the last one only modifies the conditional formatting one to give it the special value you want to use for formatting. So I created a dynamic measure calc group like the good old days (not that easy to build that with field parameters, even though I might come back to this thought at some point), I reordered the calc groups so that the dynamic measure was the lowest, then the time intel, then the sort. Of course I had to update the afftected measures table to include the dummy measures too. But then I could add yet another calc group called format that for the Dummy CF measure would leave the value of the measure if the calc item of the table was the same as the one from the disconnected slicer, and return blank otherwise. In case it was not Dummy CF it should leave everything untouched.
------------------------------
-- Calculation Group: 'Format'
------------------------------
CALCULATIONGROUP 'Format'[Format]
    Precedence = 30

    CALCULATIONITEM "Format" =
        IF (
            NOT ISSELECTEDMEASURE ( [Dummy CF] ),
            SELECTEDMEASURE (),
            VAR selectedCalcItem =
                SELECTEDVALUE ( 'Time Intelligence'[Time Intelligence] )
            VAR selectedSortItem =
                SELECTEDVALUE ( 'Time Intelligence Names'[Time Intelligence] )
            VAR isMatchingCalcItem = ( selectedCalcItem = selectedSortItem )
            VAR result =
                IF ( isMatchingCalcItem, SELECTEDMEASURE () )
            RETURN
                result
        )
In the conditional formatting option is important to mark blanks as «do not format», and remember to resort the matrix, this time by the dummy measure. And does it work?
Well, sort of.

The reason I’m not putting a video is that performance in this case is terrible. Like 10 seconds for each refresh. I guess is a bit too much calc group? I don’t think there’s much that can be changed, but who knows. I’m taking the «Inside Calculation Groups» from SQLBI+ . Maybe something there will unlock a different way of thinking and a better solution can be found.
if you want this crazy version to try to find a more efficient formulation, please be my guest
That’s it! good night
One step beyond (2023-07-30)!
For my session on the Seattle Modern Excel+Power BI User group, I decided to «industrialize» this Calculation group (without the conditional formatting bit). What I mean is that I developed a script that can create the extra calc item, the calculated table and the sort calculation group in one click in any model of your choice, as long as you right click on one of its calculation groups and select to run the macro based on this script.
Here’s the video:
If you want the script to play with it yourself, it’s posted here.
Regards!
