Some SQL Server governance that can give huge results

This blog post is 90% SQL server and 10% Power BI, so if you are not into SQL Server (or relational databases in general) this might not apply to you. That being said, this blog post explains how to record the size of all tables in the server, and how to measure which tables are being used without enabling query-logging which can bring your server to a halt (or at least so I’ve been told by the DBA).
Some context, in one of my clients they do have most of the data that they manage in a SQL server with ODS replications of operational databases and a data warehouse where all serious reporting should be based. In that sense they have things pretty much sorted out if we compare them with companies that still do critical reporting based on excel files on a SharePoint. Yet, even having a very expensive server we often run into problems and space is always a problem. So we figured to do something about it.
My partner, Carles, had a hunch that many tables were not being used at all and found a query to check the last time that a table has been queried. There were two ‘buts’ though. The query will only return results for a single database and can only say the last time that the table was queried since the last restart of the server. Thus, to get a complete picture we need to take snapshots and then do a groupby table to get the max date in which it was queried to get a sense of which tables are being used and which are not.
Yet, this is only half of the story. We need to have an idea of how big is each table in order to prioritize where should we take action. You want to focus on large tables that nobody is using. And by nobody, I mean nobody. Here it is your call how long you want to wait before you take the axe, but anything north of 2 months seems reasonable to me. Anyway, this post focuses only on how to gather the data. How you use it is your call. Similarly as with the last scan, there’s a query that will return the rows, reserved space and used space. I will not get on the details of the difference, because to be honest I don’t quite understand. But remember that rather than the exact number we are interested in relative size of tables. If you find a table that nobody uses but is less than 0.5% of the database probably is not worth your time to think if it can indeed be deleted. If it’s more like 15% then maybe it’s time to do something about it.
Multi-database queries do not play well in Power BI Service
Sometimes we might feel like we can do anything with Power BI, but that’s just a mirage sometimes. Even if you figure out how to parametrize the query and to make Power Query iterate through the different databases of your server, do not celebrate too early. Such a query will never refresh on Power BI Service, so basically you are back to the drawing board. Would be nice if it worked, but it does not.
Also, as we have seen for the scan part we do need to gather snapshots, and while you could do them using incremental refresh (if multidatabase would work that is), that’s still a terrible idea, since you will destroy everything once you publish the dataset again. For this project I’m in Pro world, so literally for anything like changing the format of a measure I do need to publish the dataset.
So, well, stored procedures and dynamic SQL are still a thing, and we can use them to iterate through the databases and store the results in a SQL table. That table will be the source of the Power BI reporting. Good thing I did some SSIS and SQL before I discovered Power BI.
Getting the last scan of each table
[sql]
DROP TABLE IF EXISTS #Databases
DROP TABLE IF EXISTS #AppendedResults
SELECT [Name] as "Database Name"
INTO #Databases
FROM sys.databases db
WHERE db.[Name] not in (‘master’,’tempdb’,’model’,’msdb’)
DECLARE @CurrentDatabase as NVARCHAR(250) = »;
DECLARE @Sql AS NVARCHAR(1000);
CREATE TABLE #AppendedResults( "RN" INTEGER, "Last User Scan" DATETIME, "Table Name" NVARCHAR(250), "Schema Name" NVARCHAR(250),"Database Name" NVARCHAR(250))
WHILE(
SELECT COUNT(*)
FROM #Databases
WHERE [Database Name] > @CurrentDatabase) > 0
BEGIN
SET @CurrentDatabase = (SELECT TOP(1) [Database Name] FROM #Databases WHERE [Database Name] > @CurrentDatabase ORDER BY [Database Name]);
PRINT @CurrentDatabase
SET @Sql =
N’INSERT INTO #AppendedResults
SELECT *
FROM (
SELECT ROW_NUMBER() OVER(
PARTITION BY b.Name, c.[Name] ORDER BY last_user_scan DESC) RN,
last_user_scan [Last User Scan],
b.name as [Table Name],
c.[Name] as "Schema Name",
»’+ @CurrentDatabase + »’ as "Database Name"
FROM ‘ + @CurrentDatabase + ‘.sys.dm_db_index_usage_stats  a
left join ‘ + @CurrentDatabase + ‘.sys.tables b
on a.object_id=b.object_id
left join sys.schemas c
on b.schema_id = c.schema_id
WHERE last_user_scan IS NOT NULL
AND b.Name IS NOT NULL
) V
WHERE RN = 1’
PRINT @Sql;
EXECUTE sp_executesql @Sql;
END
SELECT *
FROM #AppendedResults
[/sql]
Don’t take this query as plug and play, but it will generate a table with the results from all databases. From there it’s up to you how you historify this. This query is quite quick so you can run it everyday whenever there’s not a lot of activity on the database and it should not be problematic.
Getting the size of each table in the server
This one is a heavier on the system, so you might want to run it only once per week like on Saturday afternoon, where you cannot bother any critical system. It follows a similar logic to go through all the databases and gather the result of a dynamically generated SQL query.
[sql]<br data-mce-bogus="1">
DROP TABLE IF EXISTS #Databases
DROP TABLE IF EXISTS #AppendedResults
SELECT [Name] as "Database Name"
INTO #Databases
FROM sys.databases db
WHERE db.[Name] not in (‘ALS_PX’,’ODS_ALNOVA’,’master’,’tempdb’,’model’,’msdb’,’00_MANTEN_CTRL’)
DECLARE @CurrentDatabase as NVARCHAR(250) = »;
DECLARE @Sql AS NVARCHAR(1000);
CREATE TABLE #AppendedResults(
"Schema Name" NVARCHAR(128),
"Table Name" NVARCHAR(128),
"Total Reserved kB" BIGINT,
"Used Space kB" BIGINT,
"Rows" BIGINT,
"Database Name" NVARCHAR(128))
WHILE(
SELECT COUNT(*)
FROM #Databases
WHERE [Database Name] &gt; @CurrentDatabase) &gt; 0
BEGIN
SET @CurrentDatabase =
(SELECT TOP(1) [Database Name]
FROM #Databases
WHERE [Database Name] &gt; @CurrentDatabase
ORDER BY [Database Name]);
PRINT @CurrentDatabase
SET @Sql =
N’INSERT INTO #AppendedResults
SELECT
s.name as "Schema Name",
OBJECT_NAME(t.object_id) as "Table Name",
SUM(u.total_pages) * 8 as "Total Reserved kB",
SUM(u.used_pages) * 8 "Used Space kB",
MAX(p.rows) "Rows",
»’+ @CurrentDatabase + »’ as "Database Name"
FROM ‘ + @CurrentDatabase + ‘.sys.allocation_units u
INNER JOIN ‘ + @CurrentDatabase + ‘.sys.partitions p on u.container_id = p.hobt_id
INNER JOIN ‘ + @CurrentDatabase + ‘.sys.tables t on p.object_id = t.object_id
INNER JOIN ‘ + @CurrentDatabase + ‘.sys.schemas s on t.schema_id = s.schema_id
GROUP BY
t.object_id,
s.name,
OBJECT_NAME(t.object_id)’
PRINT @Sql;
EXECUTE sp_executesql @Sql;
END
SELECT *
FROM #AppendedResults
[/sql]
This query works fine for most databases, but for the DWH one it can stay there forever. I was told that the whole thing takes like 3h in our server. Oh well. With a weekly snapshot we get already a good sense of what we have and how big is it. And since we are historifying it we can also see who are the fastest growers by size and by percent to check if it makes sense.
What I’m sharing here are the development queries I sent to the server guys to historify. On the process of course they added an «execution date» column that will come in handy especially to analyze the evolution in size of tables, as well as getting the last snapshot.
The report
Now that we have the data, building the report is quite straight forward.
Take the Last Scan table and do a group by database, schema and table name. Aggregate by max on the last scan column. This will provide the last time each table was used, even accounting for possible restarts of the server.
Now take the lastest snapshot of the Table Size query. This will give you the complete inventory of tables you have on the server. Merge it with the previous query (left join) and you’ll get a complete list of tables with the latest scan.
Of course some tables may have never been read, so you’ll have a null for last scan. The way I dealt with it is to assume that the day before data started being collected, all tables where scanned (which is probably not true, but is the safest bet). So after you perform the join you can create a custom column in power query (or SQL if that’s your thing) and put the date for all those that have nulls. Otherwise pick the date that was found as last scan.
And that’s pretty much it. You can add a measure that calculates the average days since a table was last used, and you can use it for conditional formatting of a bar char (no legend field is used). From there, the minimum value I set it to black and maximum value to a light gray. Then for the axis you can use Database, schema and table, so you can narrow down on those databases that are not pure-black and see where are the main culprits. I guess you could weight the average by the size of the table if you wanted — just multiply the days by the size and divide the result by the sum of the days.
Anyway, after 6 days the report looked like this
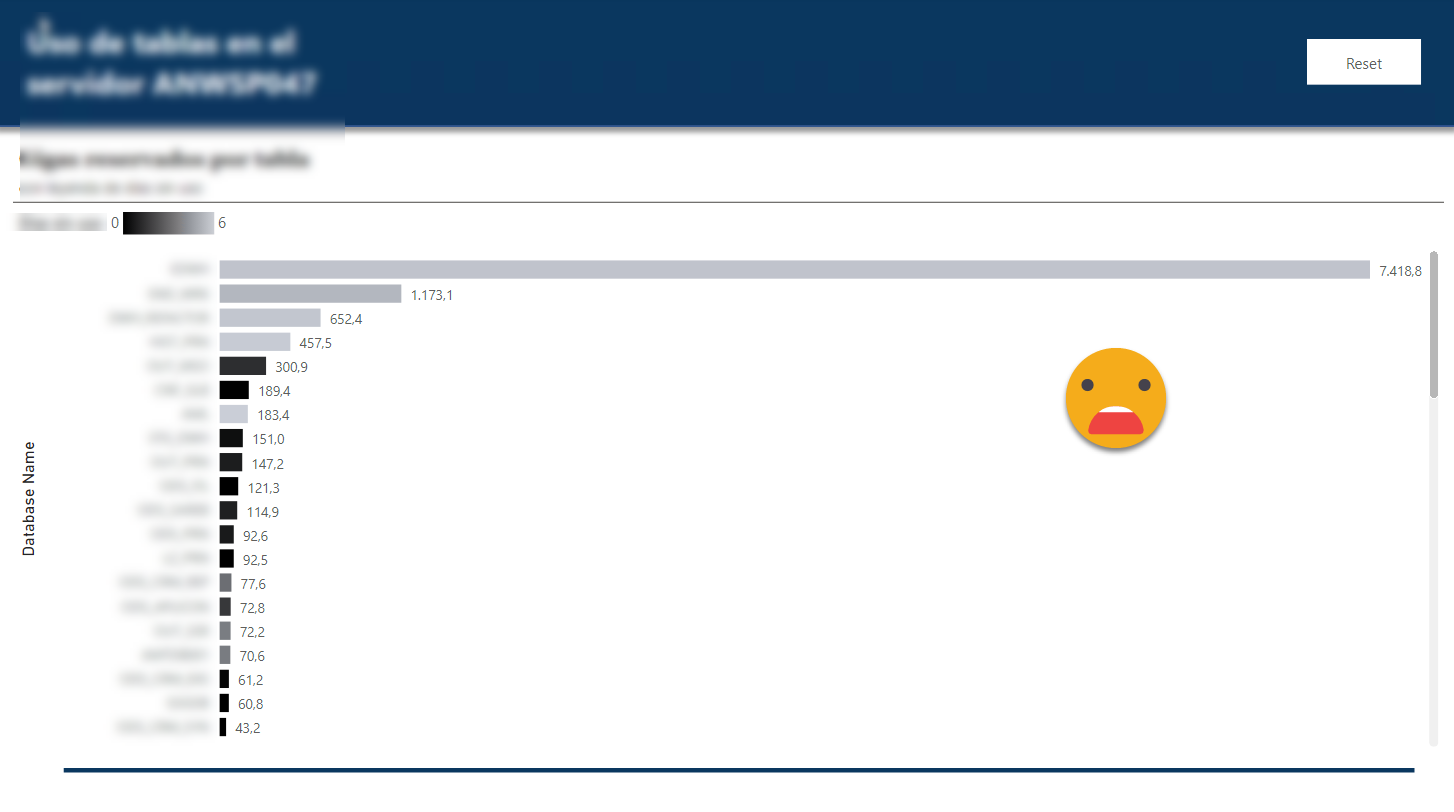
First it shocked me how huge the dwh database really was (first bar of the chart). It it was used I guess it’s all worth it but it was so light gray… Well 6 days it’s not much, but hey, NOT A SINGLE TABLE SCAN. Not a good omen.
Indeed after a few days we realized that the top 5 tables of the dwh were some obscure bridge tables that were supposed to «help» build queries… but were so big that the queries would not run at all. So nobody used them.
A few days later (and after fulminating some of those elephant tables) the picture is a bit better, but not that much
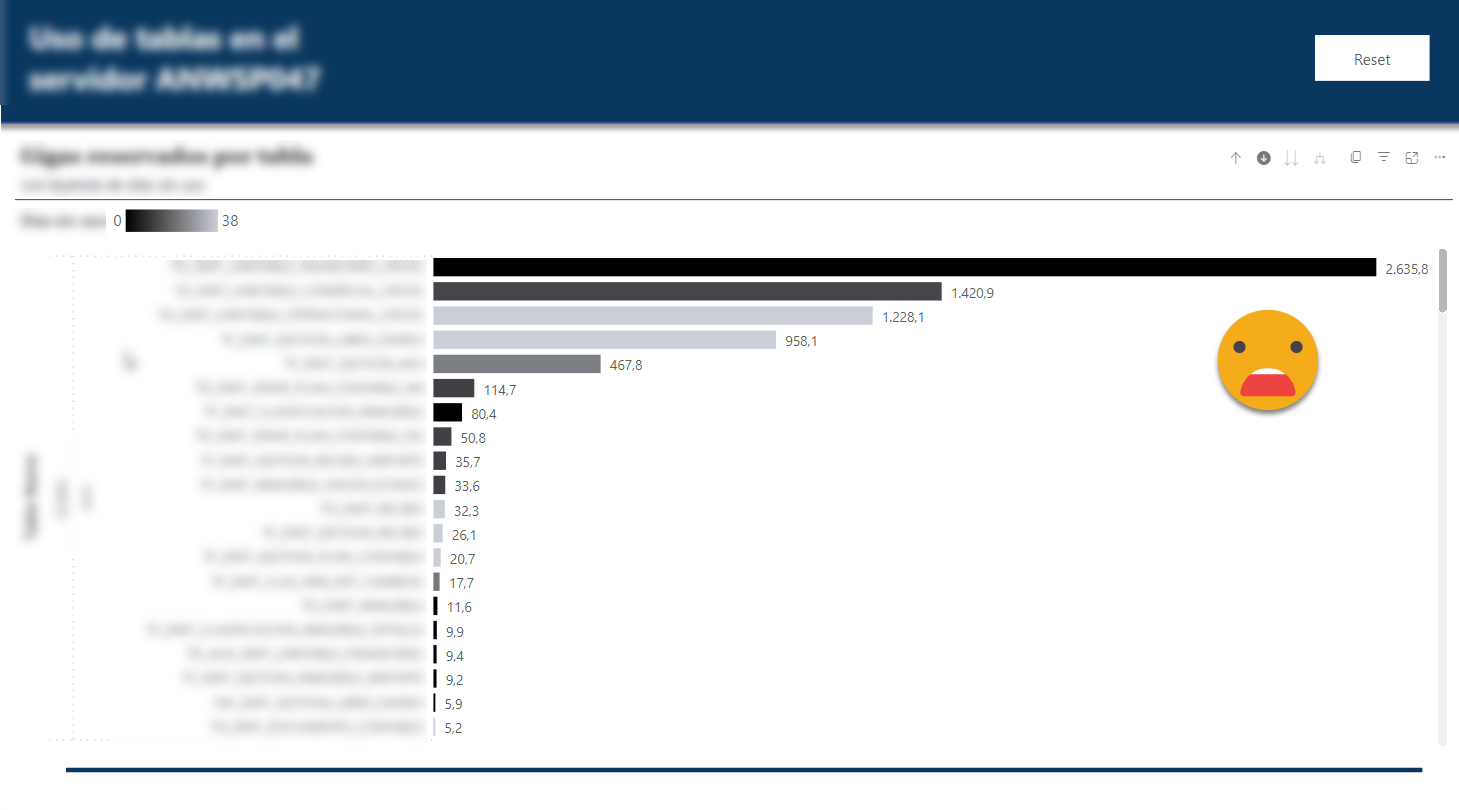
This is the view at table level of the dwh database. At least now the top table is being used, but there’s plenty of room for improvement.
Using just the ‘Table Size’ table you can also build some reports to spot the tables that grow faster, if you want to double check if everything is going fine with them. In that front we haven’t done much yet so I’m not going to go in further detail. You can do anything you want with the data, but first you need a question to answer! once the problem is defined you can find the best implementation to do it.
Thank you for reading this blog post, even as it differs from most of the rest of the blog — take care
Follow the conversation on Twitter and LinkedIn