Building arbitrary tables with 2-level column headers

If you have worked with Matrix visual you probably have faced the problem: Your end user would like to group all the measures that are thrown in into neat little groups, putting all de Quantity- related measures in one group, all the value measures in another, for example. What I’ve seen so far is that people just struggle with the fact that this is not possible in the Matrix visual, and add text boxes on top, as if the header was indeed a two-row header. But it’s not. And if you have a large matrix that requires horizontal scroll, you’ll know what I am talking about. Can we do any better? Yes. Are calculation groups involved? You bet. Difficult DAX? Not at all!
(Disclaimer: I really thought the first technique would work! if you are here for the working solution scroll down to the end. If you also want to learn some ways that do not work, keep reading!)
To come out with this technique, I started from the basics: in Power BI categories where all the measures are blank are not displayed. This is important and leads us to the solution (it’s a trap!). Basically we want to establish a table with some categories, and underneath each category we only want certain measures to be displayed. Well, this is a very simple calculation group. Each calculation item is a category. If the measure is one of the measures of the category, display the measure. Otherwise blank. That’s it.
The article could end here, but let’s see exactly how that would work. (spoiler: No, it does not work)
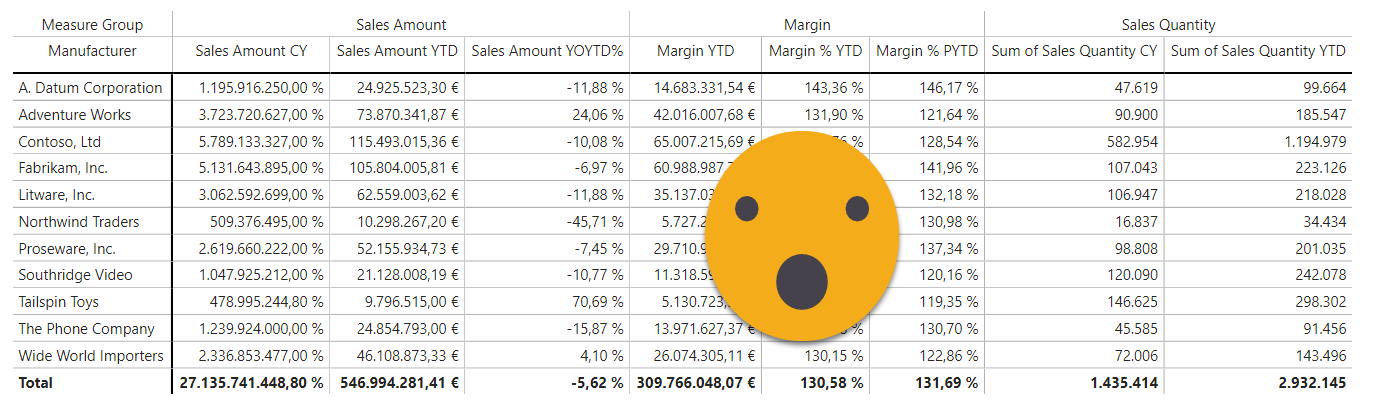
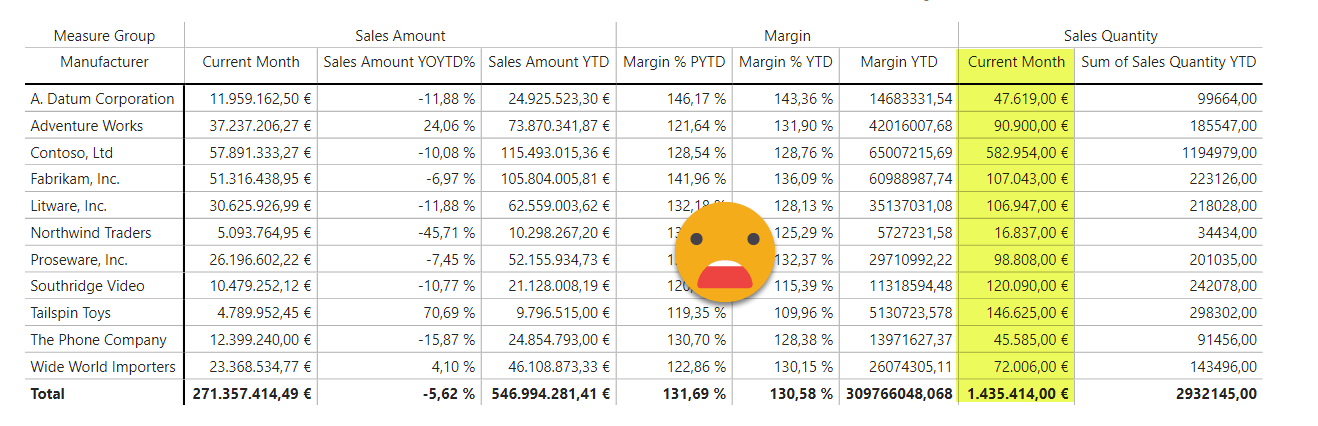
Let’s start with our beloved Contoso model with a goal table something like this:
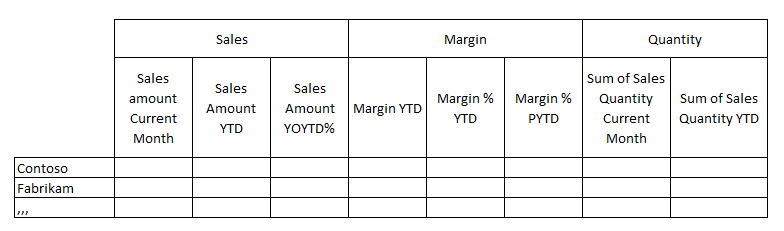
As we see we need some base measures Sales Amount, Margin, Margin %, Sum of Sales Quantity, and some standard time calculations. The measures are very straight forward
------------------------
-- Measure: [Total Cost]
------------------------
MEASURE 'Sales'[Total Cost] = SUMX(sales, Sales[Sales Quantity]*Sales[Unit Cost])
    FormatString = "#,0.00\ ""€"";-#,0.00\ ""€"";#,0.00\ ""€"""

-----------------------------------
-- Measure: [Sum of Sales Quantity]
-----------------------------------
MEASURE 'Sales'[Sum of Sales Quantity] = SUM('Sales'[Sales Quantity])
    Description = "This measure is the sum of column 'Sales'[Sales Quantity]"
    FormatString = "0.00"

--------------------------
-- Measure: [Sales Amount]
--------------------------
MEASURE 'Sales'[Sales Amount] = SUMX(sales, Sales[Sales Quantity]*Sales[Unit Price])
    FormatString = "#,0.00\ ""€"";-#,0.00\ ""€"";#,0.00\ ""€"""

----------------------
-- Measure: [Margin %]
----------------------
MEASURE 'Sales'[Margin %] = DIVIDE( [Margin], [Total Cost] )
    FormatString = "#,##0.00 %"

--------------------
-- Measure: [Margin]
--------------------
MEASURE 'Sales'[Margin] = [Sales Amount] -  [Total Cost]
    FormatString = "#,0.00\ ""€"";-#,0.00\ ""€"";#,0.00\ ""€"""
Then we want some time calculations over these measures so we fire the Time Intelligence Calculation Group Script selecting the measures as affected measures. However, with only this we cannot build our table.
It is clear we need to be able to select combinations of base measure + calculation, and the best way to do that is with measures. Wait, am I proposing to go to the good old days of time intelligence measures? yes, but not that way. First of all, we’ll be using the calculation group to create the measures, so the logic will still be encapsulated. And secondly, it’s not going to be time-consuming because we’ll generate all the measures with one click with the awesome script from Stephen Maguire (if you are into Tabular Editor C# scripts, do follow him). The script can be stored as macro because it needs no «cold» configuration and it all happens at run-time. I call this «one-click compliant» — even if you’ll need quite a few more clicks to complete the process. The cool thing is that you can have that in a toolbar (if you use TE3) and you’ll use it a lot more, trust me. Anyway, after running the script my object model looks like this:
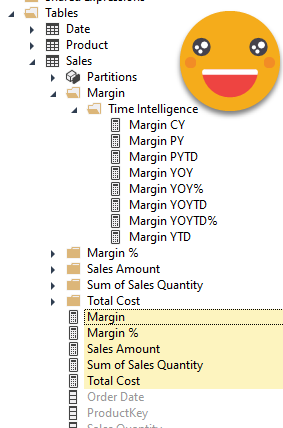
(Note: at the time of this writing the script can’t determine the resulting format string so it keeps the base measure format string, so we manually modify those measures that are a percent.)
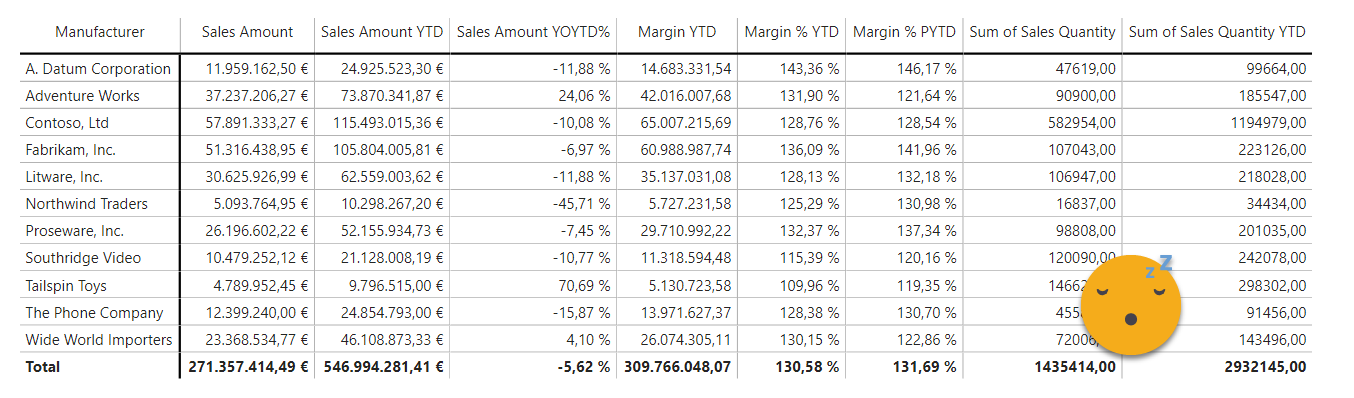
At this point we can already build the table with the lowest level headers, but that’s boring — there is no structure that tells us which columns are related. You can get there with old-school time intelligence measures (and some patience)
So what is to be done? Of course, «group» the measures in calculation items that will blank out any other measures. At this point is important to think big. Can you be 100% sure that you (or your customer) will not want to add an extra column in the matrix? Now that they’ll get decent horizontal scrolling of headers they might throw in a few more, I’m sure. So the answer is «No, i’m not 100% sure this is the final set of columns. However! you can be 99,9% sure of all the candidates that will go to the Sales Amount group, Margin Group and Sales Quantity Group, right? Then put all the potential columns in each group — remember that only the measures that you add to the visual can be shown anyway (that’s an even more basic rule to remember).
However, you might say — «hey I know the calc items you described are easy to write, but also quite boring to type. Isn’t there a better way?» Since I already mentioned calculation group, the only «better» way out there is of course a C# script to create a calculation group!
Here you can have a look at the script
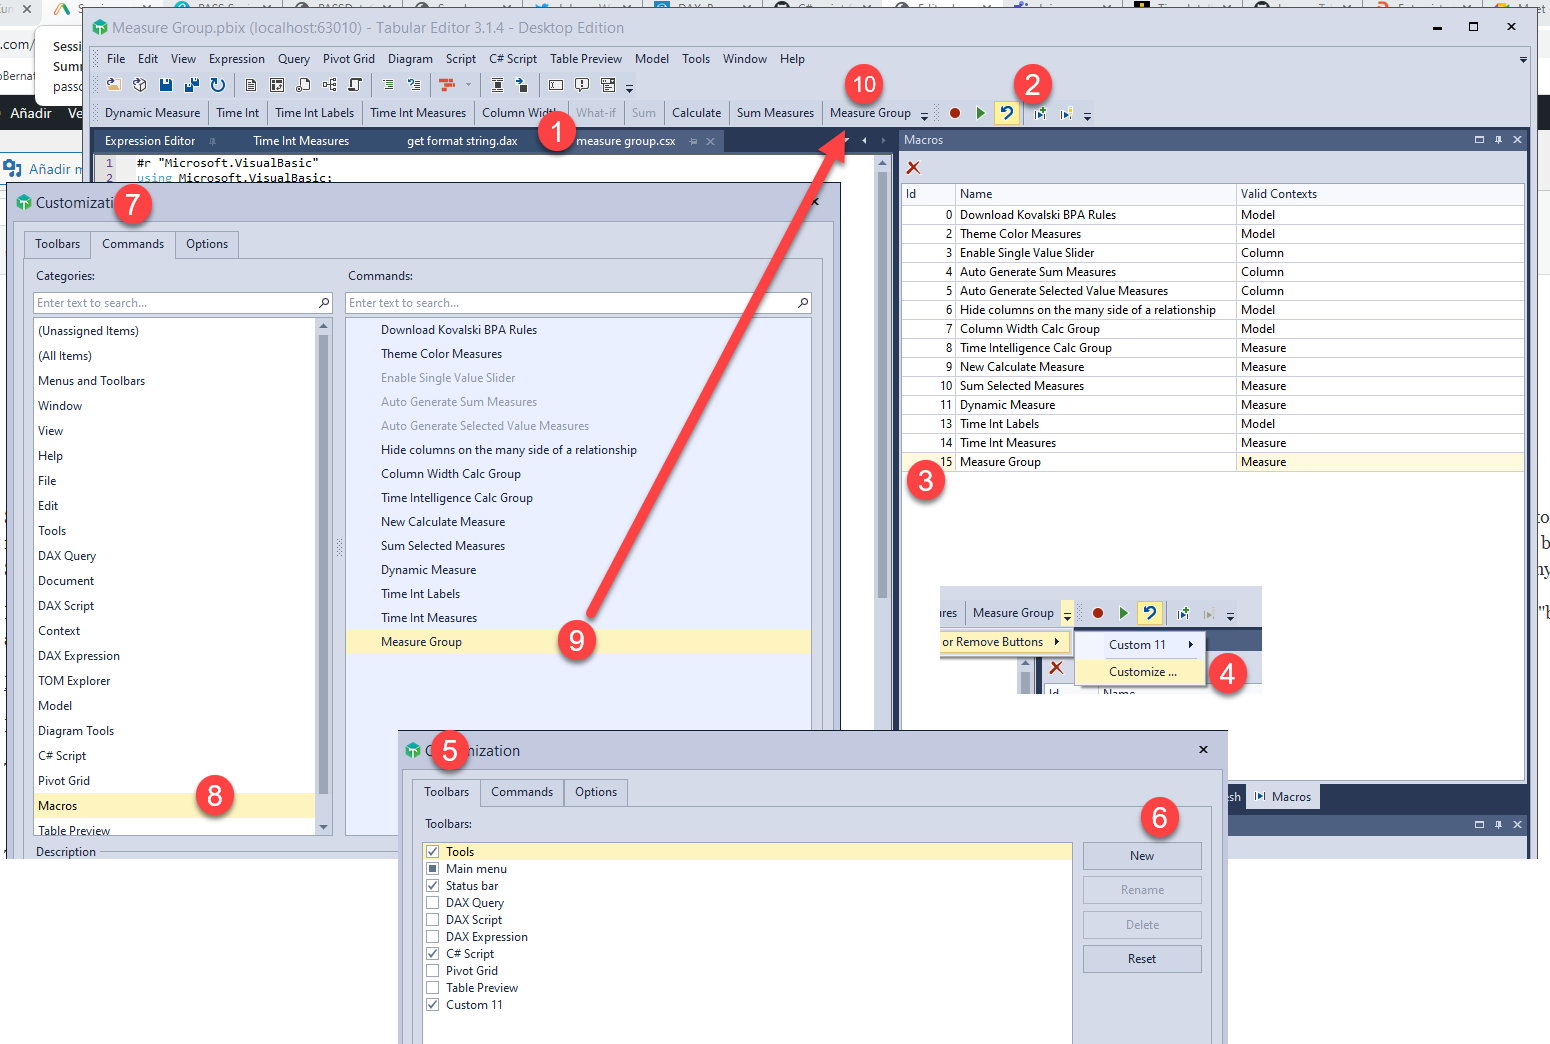
Like the two previous scripts used in this post, this one is also one-click compliant, so save it as a macro or custom action, and if you’re in TE3 put it in your macro toolbar, totally worth it. What? you use TE3 and you are not using a macro toolbar? you are totally missing out. Patrick does a good job explaining how to do this in this moment of this video. But if you want a quick step by step
- have the script in a c# script tab
- Click on «Save as macro..» (the arrow with the + sign)
- You give it a name and it will appear on your macro list
- Go to any toolbar, click on the little arrow and click «customize»
- Click on Toolbars
- Click on New to create new toolbar to put your macros (first time only)
- Click on Commands
- Click on Macros
- Drag and drop the macro you want to place on the toolbar
- The macro will show in your toolbar (right clicking on the button will allow you to change the name or begin a new group, which separates things a bit <- highly recommended)
Ok sorry, let’s go back to the script to create measure groups.
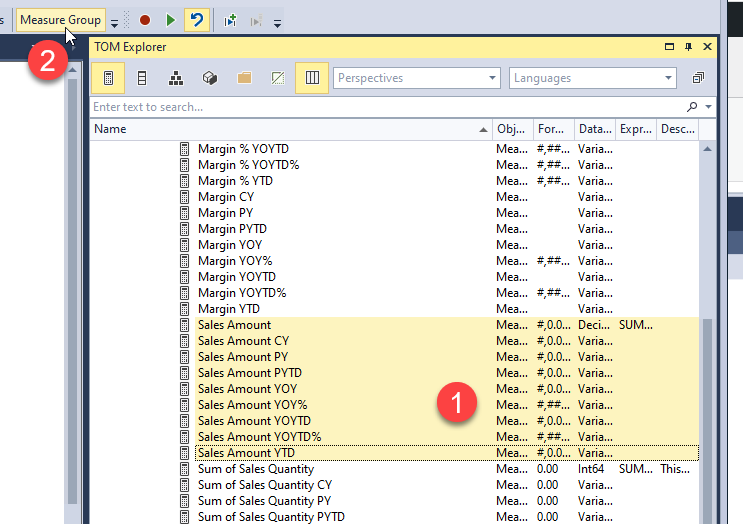
To use it is super easy. Just select the measures that you want in the same group (1), and execute (via right click, via macro button (2), or even play on the script, your call).
The first time the script will have to create the calculation group, so it will ask how to name it.
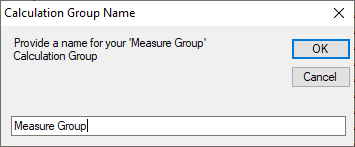
The second dialog box is to provide a name of the calculation item, which will be visible when we use it in the matrix, is the measure group name.
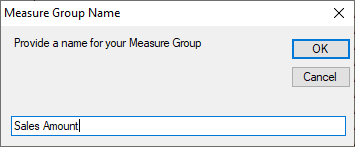
This will result in your new calculation group with a single calculation item
When you repeat for margin measures, you are asked directly for the calculation item name. The same the third time, of course.
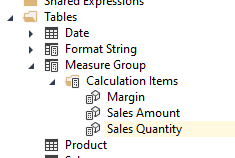
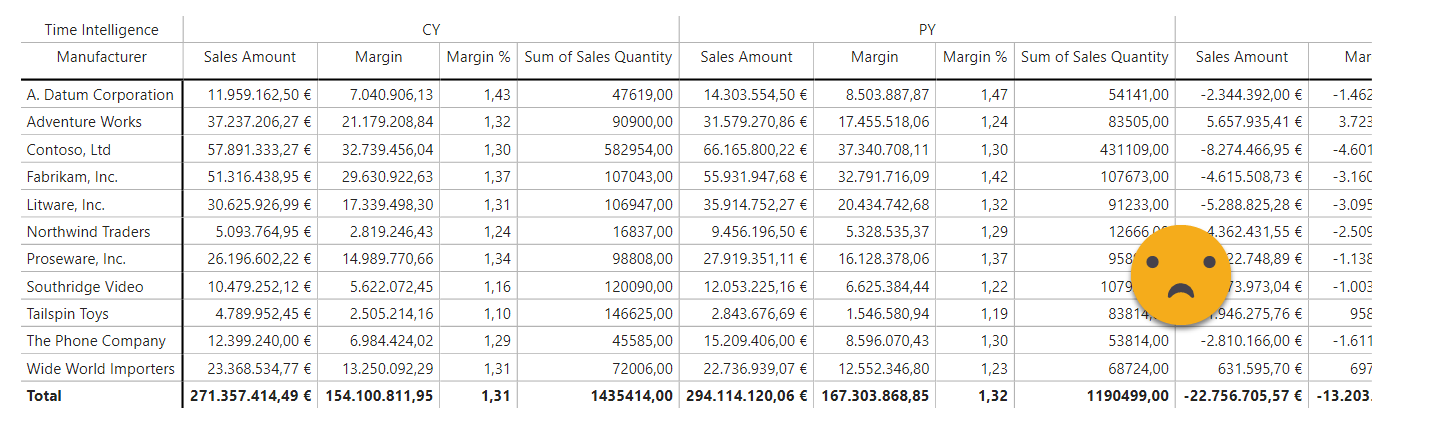
We can sort the calculation items (by drag and drop), and finally we can add our measure group dimension in the matrix visual…
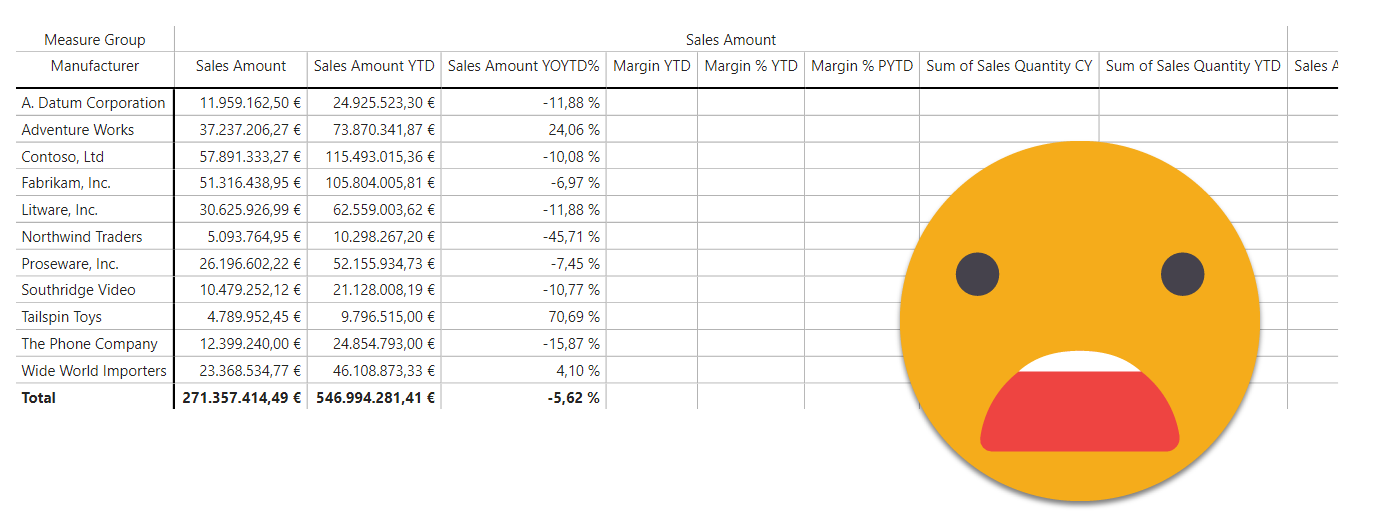
WHAT?
Ok, it does not work. I thought it would, but it did not. Funny thing is that I thought I was replicating something that worked, but turns out I was implementing it differently. The rule that when all blank don’t show it is for values along some column, for which all measures are blank. If you are slicing sales amount by city and all your sales are in the same city, only that city will show. However if you also add a «new Customers» measure, and there are no customers, the column will show, blank.
What is to be done then…?
Before actually replicating the strategy that worked, I tried one more thing that could possibly work, which deep inside I knew it would not, but it was not much effort and thought it would be worth a shot. That is replicating the measures, by the dynamic measure calc group by Johnny Winter (aka Greyskull Analytics). The theory went, Johnny’s calc group will transform the dummy measure into each of the measures, and my calc group will blank out those that do not apply.
At first that did not look good at all…
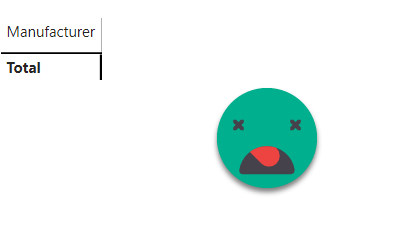
In cases like this you need to remember that for some reason the default view of a matrix is without showing any detail, if you have to fields in columns it will show only the first. In our case I’m not sure how’s that suppose to work, but anyway, we see that the result is a huge blank. Now, what happens if we drill down this emptiness?
So this approach works! What’s interesting is that I do not need to include the «dynamic measure» in my list of affected measures by the time intelligence calc group — so the dynamic measure calc group effectively «cheats» the time intelligence calc group into believing that [Sales Amount] is in the scope. That’s something I wasn’t sure of and now I could confirm.
I think on my first try I did not realize that I needed to drill down and I discarded the approach. So anyway, here on I try another two approaches with the similar result. If this is all you need you can stop reading, but if you want to be able to have 2nd row headers that look the same (like «YTD») and still get the right format string without reinventing the wheel you will need to go to the end because with the previous approach and the following 2, getting the right format string for such shared items, is way to complex and hard to maintain as you will see in the following paragraphs.
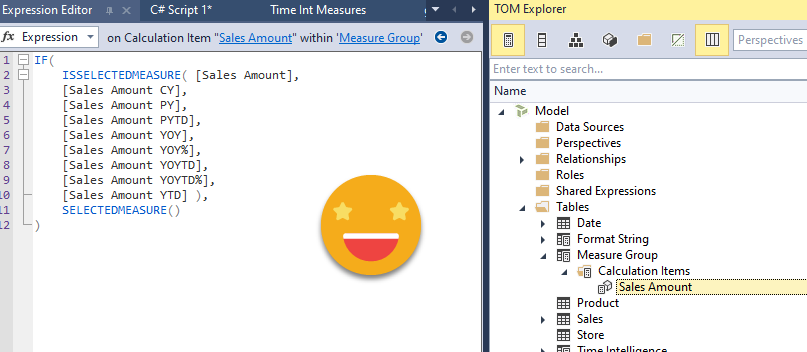
Looks like I would have to implement the original solution, even as it is not so straightforward. Our «Measure Group» will be just different Calc Items with «SELECTEDMEASURE()» as value expression. In fact you could even do it with a regular disconnected table, but it might be more flexible this way, as I’ll explain later. Then the logic is in a modified Dynamic Measure calc group, which checks the selected value in the «Measure Group» calc group (terrible name I know) and returns the measure corresponding to its name, if and only if that selected value is indeed it’s group. Let’s see that with an example (because with that explanation I would not understand it either)
Remember: Measure Group calc Items are just «SELECTEDMEASURE()» no modifications whatsoever. Now, for the dynamic measure calc item’s well do some tuning. (first by hand, then later, hopefully by code! at the point of writing I haven’t done it yet).
Sales Amount CY =
IF (
    ISSELECTEDMEASURE ( [Placeholder for Dynamic Measure] ),
    VAR measureGroup =
        SELECTEDVALUE ( 'Measure Group'[Measure Group] )
    RETURN
        IF ( measureGroup = "Sales Amount", [Sales Amount CY] ),
    SELECTEDMEASURE ()
)
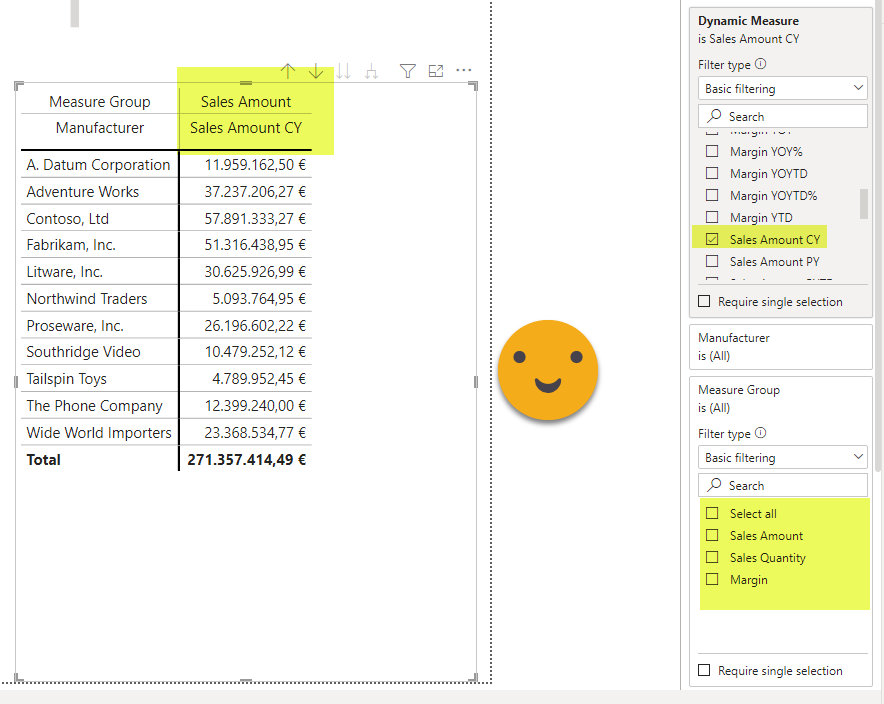
Once you see it, it’s quite obvious, isn’t it? Well, it turns out this approach does work, because there’s only and measure, and all the logic works on the actual measure placed in the visual. Putting the Measure group calc group column without any filters, and the Sales Amount CY calc item of they dynamic measure calc group, shows only one column (and not three!). And it shows where it belongs!
However I don’t like that you have to hard code the name of the group so many times, though. Isn’t there a better way? What about I do it the other way around? In the measure group calc group I encapsulate the logic for blanking out the dummy measure (at this point I am blogging live).
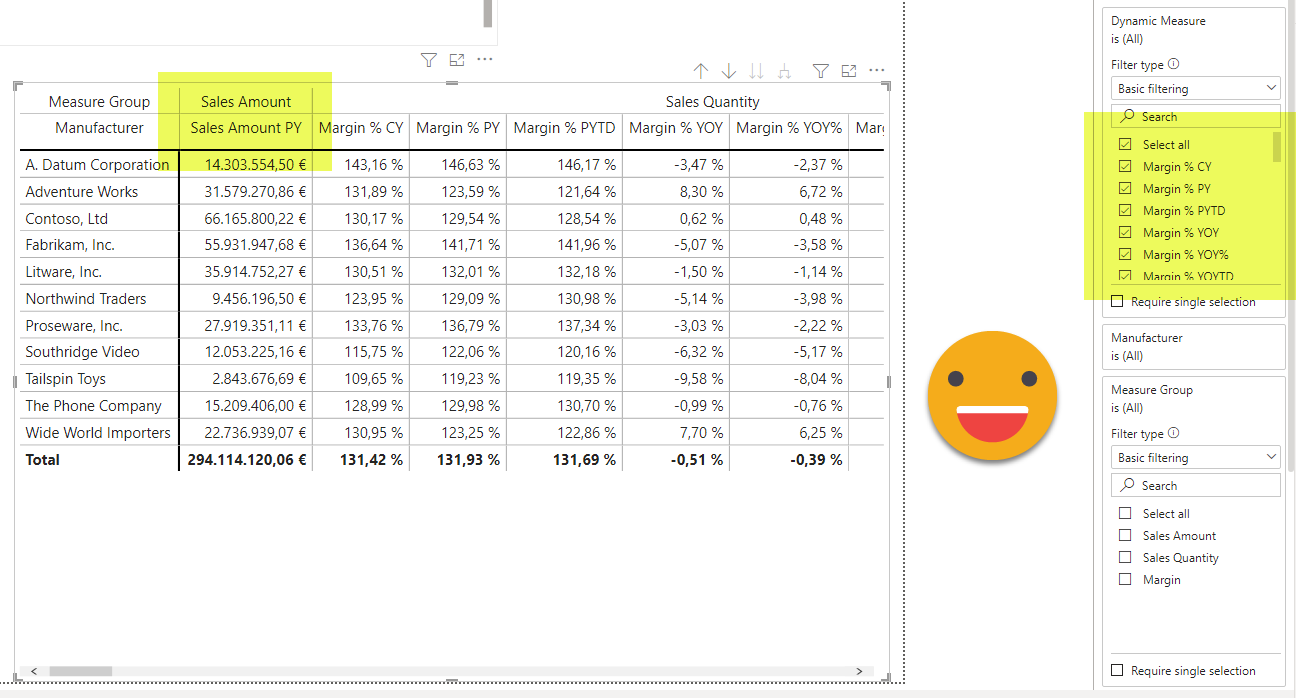
Indeed, with this calc Item
Sales Amount =
IF (
    ISSELECTEDMEASURE ( [Placeholder for Dynamic Measure] ),
    VAR measureItem =
        SELECTEDVALUE ( 'Dynamic Measure'[Dynamic Measure] )
    RETURN
        IF ( measureItem IN ( { "Sales Amount PY" } ), SELECTEDMEASURE () ),
    SELECTEDMEASURE ()
)
it works just as well!
In the plus side you have to modify only 3 calc items, and you have all your logic together. And you can use Johnny’s script as-is. The only thing is that if you change a calc item name from the measures one you’ll have to update the measure group calc item to match it! If you do it the other way around you have to create all the calc items with the extra logic and if the Measure Group calc item name changes, then you have to modify it in all Measure calc items! I think I’ll keep the logic in the measure group calc item. So, completing for all «measures» (which are now rather calc items) it would look like this (FINALLY!)
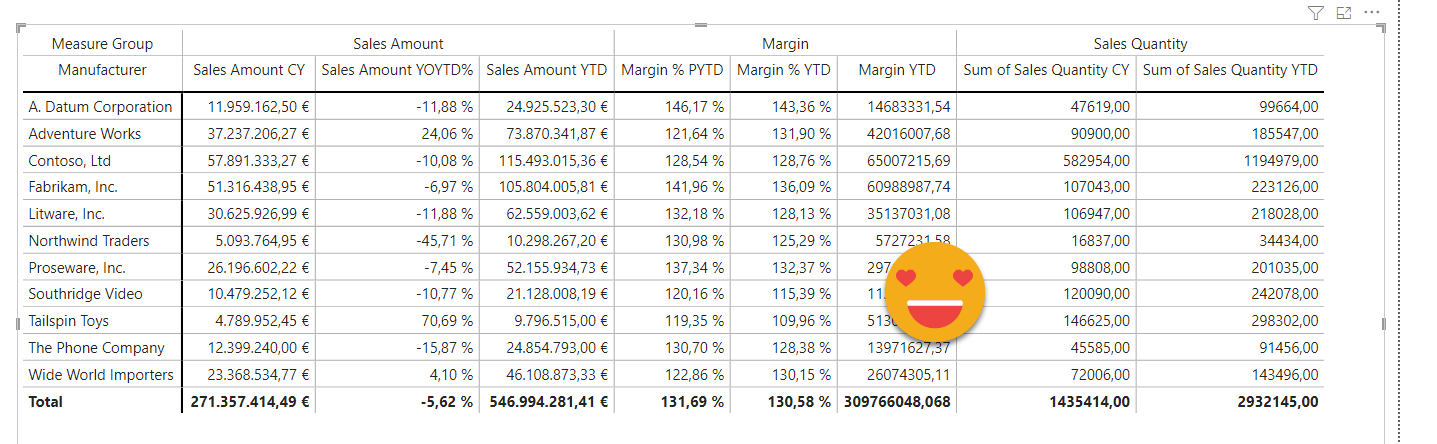
Calc Items are like this
Sales Amount =
IF (
    ISSELECTEDMEASURE ( [Placeholder for Dynamic Measure] ),
    VAR measureItem =
        SELECTEDVALUE ( 'Dynamic Measure'[Dynamic Measure] )
    RETURN
        IF (
            measureItem
                IN ( { "Sales Amount CY", "Sales Amount YTD", "Sales Amount YOYTD%" } ),
            SELECTEDMEASURE ()
        ),
    SELECTEDMEASURE ()
)
Now this blog post is already long, but let’s ask once again… can we do better??
Something I hate when I am cleaning data is when the concept is split in two rows, and the second row alone is not enough to understand the column — like in «Sales Amount YTD» it only says «YTD». From a data perspective it’s terrible, but from an end-user perspective it’s actually pretty good, less redundant, more compact, intuitive. Can we get there in a matrix visual? If we try to just rename the calc items for dynamic measure, we’ll stumble in the fact that all calc items must have different names (duh!) also from the measure group calc item we should choose among two calc items with the same name??
If we are ok with moving away from the general solution (which we just saw) and we want to get into the manually crafted super nice visual world, we can add some DAX to the dynamic measure calc item so that when the Measure Group item is Sales Amount it shows Sales Amount YTD, when it’s Margin then it shows Margin YTD.
So it works… but it doesn’t! we should add logic to get the correct format string … at this point I realized I was going down the wrong rabbit hole. If I just wanted to get the calculation item name (without the measure name) why wasn’t I using the time intel calc group?? That’s a good question… I could just use a dynamic measure calc group (just with my base measures as groups) and then use the time intel calc group to get the different calculations in the table. From there I can do further fine-tuning. Let’s see how that works.
Now it’s the good one, trust me!
Step one, we use the dynamic measure calc group script and create it for just the base measures. Each item looks like this
Sales Amount =
IF (
    ISSELECTEDMEASURE ( [Dynamic Measure] ),
    [Sales Amount],
    SELECTEDMEASURE ()
)
If we use this calc group together with the time intel calc group in the visual we get the following
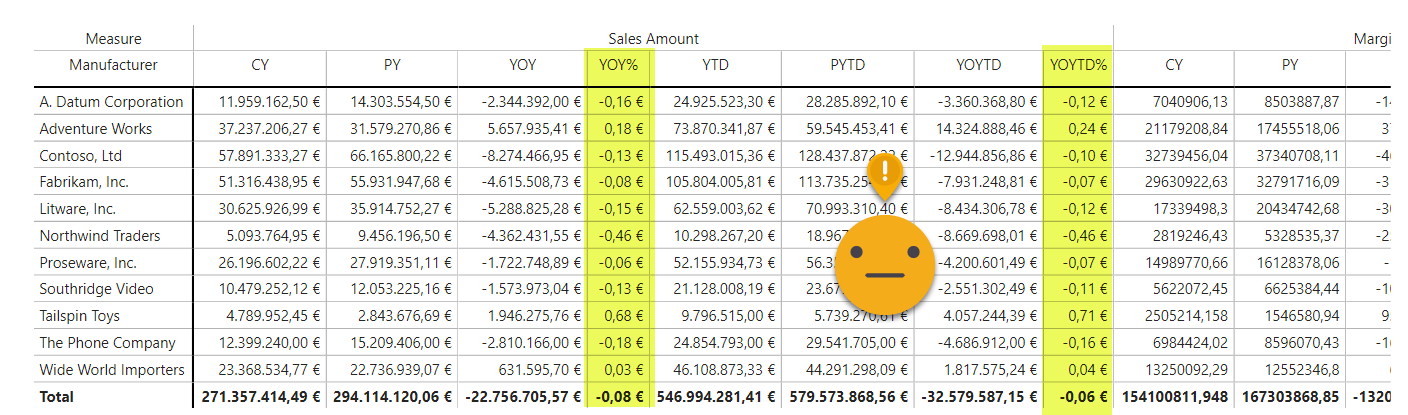
We’re getting closer, but we need to solve a couple things: We don’t want all the calc items for each measure, and for some reason the format string is wrong for % calculations… The first we already know how to solve (with some DAX checking the current calc Item) and the second is due to Calc Group precedence. Since I recreated the dynamic measure calc group, by default new groups are created with higher precedence. And dynamic measure calc groups applies the format string of the original measure. That’s why it overwrites what the time intel calc group carefully set up. Also relevant is if the «dynamic measure» is listed or not in the «Time Intelligence Affected Measures» calculated table. I realized that if it’s not there, then the dynamic measure has to have the highest precedence, but then the format string is wrong. Much better to have the dynamic measure in the affected measures list and the time intelligence calc group with the highest precedence. Now the dynamic measure calc item looks like this (I changed the CY calc item name to «Current month» as we’ll be slicing by month)
Sales Amount =
IF (
    ISSELECTEDMEASURE ( [Dynamic Measure] ),
    VAR selectedCalculation =
        SELECTEDVALUE ( 'Time Intelligence'[Time Intelligence] )
    RETURN
        IF (
            selectedCalculation IN ( { "Current Month", "YTD", "YOYTD%" } ),
            [Sales Amount]
        ),
    SELECTEDMEASURE ()
)
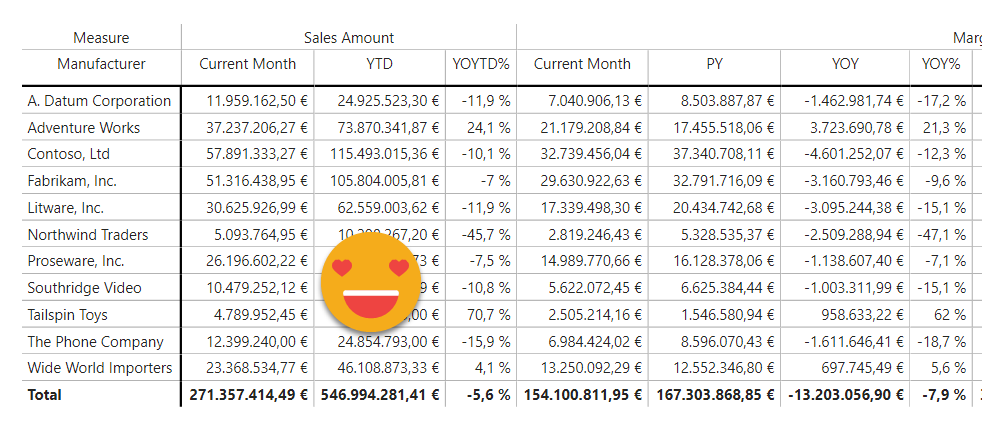
And this works wonderful for Sales Amount group
Now what is to be done about margin? We want to have both Margin YTD and Margin % YTD. Well, first of all we’ll need different calc items in the time intelligence Calc Group, we can call them € YTD and % YTD and are just copies of the standard YTD calc item. Then in Margin calc item we’ll do the logic to use one or the other depending on the calc item selected
Margin group (value) =
IF (
    ISSELECTEDMEASURE ( [Dynamic Measure] ),
    VAR selectedCalculation =
        SELECTEDVALUE ( 'Time Intelligence'[Time Intelligence] )
    RETURN
        SWITCH (
            TRUE (),
            selectedCalculation IN ( { "€ YTD" } ), [Margin],
            selectedCalculation IN ( { "% YTD", "% PYTD" } ), [Margin %]
        ),
    SELECTEDMEASURE ()
)
It’s important not to forget the part about the format string!
Margin group (format string) =
IF (
    ISSELECTEDMEASURE ( [Dynamic Measure] ),
    VAR selectedCalculation =
        SELECTEDVALUE ( 'Time Intelligence'[Time Intelligence] )
    RETURN
        SWITCH (
            TRUE (),
            selectedCalculation IN ( { "€ YTD" } ), "#,0.00\ ""€"";-#,0.00\ ""€"";#,0.00\ ""€""",
            selectedCalculation IN ( { "% YTD", "% PYTD" } ), "#,##0.00 %"
        ),
    SELECTEDMEASUREFORMATSTRING ()
)
For quantity there’s nothing new, so doing all of it, here we (finally!) go —
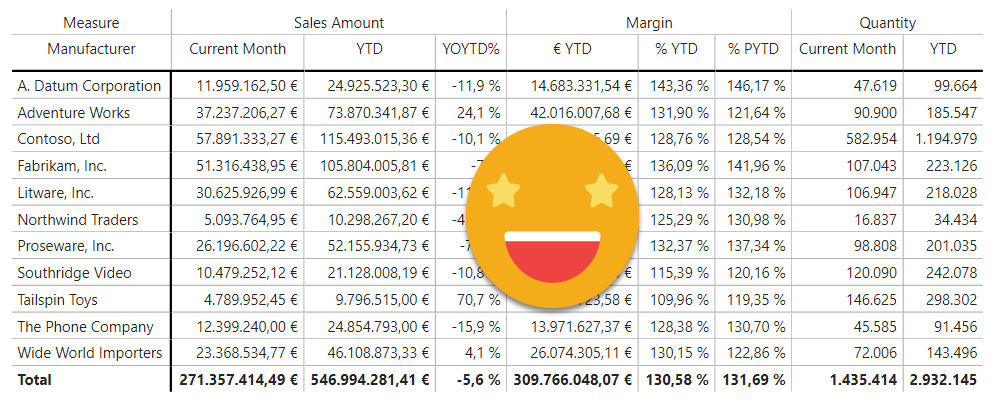
So more than measure groups, we build calc item groups! I realize that my script as it is now it does nothing useful, and I need it to generate the code similar to the final version. Merging items from different measures like we did in Margin most likely will require some manual editing, but if we can get the code for Sales Amount group or Quantity that will we more than enough. I think it’s wise to close this post now and maybe get some feedback before thinking the best way to put the new –and useful– script together.
If you read the whole article I salute you! I really thought it would be an easy one. Well, I was wrong! Unless I come up with a nice script I will not be using that a lot, but now we know the theory to build these 2-header-row tables
Ps. Could this approach be used for 3 or more levels? of course! just use the same approach including all the calc items that should display underneath — might be a bit nasty to maintain if there are many changes, but in theory it should work.
UPDATE: do you think this was way too hard for such basic stuff, go and vote for this idea!
UPDATE (2022-03-19):
- Apparently I forgot to link to the file, here you have the link!
- I did come up with a script to create each of the calculation items, might do a post about it, but here’s the link (coming up in a few days on the powerbi.tips repository too). You have to select the time intelligence calc items and the measure and run the script. It will create a calc item that will work as a dynamic measure calc item, but will display only for those calc items selected
You can comment this post on its announcement in Twitter or Linkedin