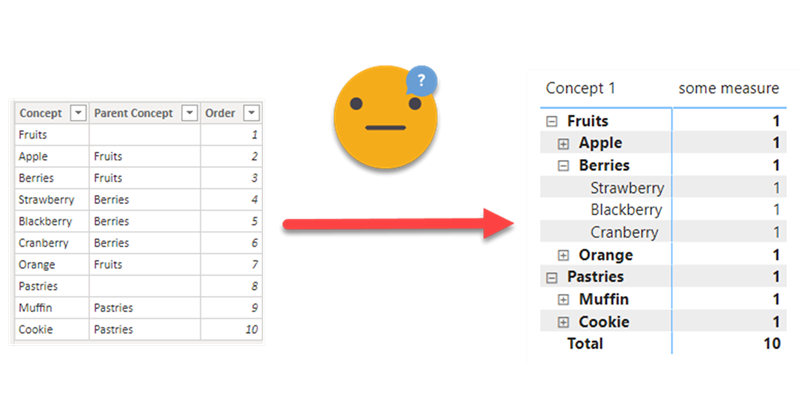
This is one problem that you don’t realize it’s a problem until you face it.
Happened to me designing a P&L report. For this report, an arbitrary list of items (arbitrary to me of course) has to be displayed in certain order, each with it’s own arbitrary calculation, and even with some hierarchy indentation. Easier said than done, really.
I was lucky enough to have seen Bob Duffy‘s session at Global Power BI Summit 2021 about P&L reporting, to the modeling part was mostly sorted out which was the focus of his session. I’ll go in more detail into that in a future post.
Regarding the hierarchy, for each item to be shown, a «Parent Item» column identified who should be the parent of that item.
something like this
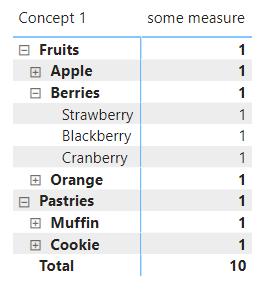
and the desired result (which will come again at the end of the post is this one:
Important that we need absolute control on what value is shown for each row, and the value for parents may or may not be the roll-up sum of its childen.
So let’s get to it. With just a parent concept column you get nowhere, but with a calculated column that goes like…
Path =
PATH ( SortedHierarchyTable[Concept], SortedHierarchyTable[Parent Concept] )
…you get all the items separated by a pipe until you reach an item whose parent is blank (if you use «TOP» or something like that to signal that it has no further parents it will produce an error as it cannot find «TOP» in the ID column. It needs to be really BLANK)
Then if you do
Path Length =
PATHLENGTH ( SortedHierarchyTable[Path] )
you get the length and see how many columns you need to build a complete hierarchy in a Matrix.
In my case it was just three, so I created Concept 1, Concept 2 and Concept 3, using
Concept 1 =
PATHITEM ( SortedHierarchyTable[Path], 1, TEXT )
… and so on.
My first problem was how to hide all the blank rows that appear on a Matrix if you just use Conpcept 1, 2 and 3 to as row fields.
To not complicate things too much we’ll go with COUNTROWS form the original table for the measure.
In such cases, function ISINSCOPE and ISBLANK are your friend
some measure :=
SWITCH (
    TRUE (),
    ISINSCOPE ( 'SortedHierarchyTable'[Concept 3] )
        && ISBLANK ( SELECTEDVALUE ( 'SortedHierarchyTable'[Concept 3] ) ), BLANK (),
    ISINSCOPE ( 'SortedHierarchyTable'[Concept 2] )
        && ISBLANK ( SELECTEDVALUE ( 'SortedHierarchyTable'[Concept 2] ) ), BLANK (),
    COUNTROWS ( 'SortedHierarchyTable' )
)
However I don’t want the matrix to really work as a matrix, I want each row to be independent from possible children it has. If I’m counting rows, it should be 1 for each row and 10 for total. I need to get what is the item of the current row (in the matrix!) and then filter the «SortedHierachyTable» by that Item. Of course for total I don’t need to do that. (I reality it’s a more complex measure I’ll dive it into another post, but the challenge was similar in that sense. ) Anyway, the measure itself it’s not the point of this post, so I’ll just put it here so we can move on.
some measure =
VAR currentItem =
    SWITCH (
        TRUE (),
        ISINSCOPE ( 'SortedHierarchyTable'[Concept 3] )
            && NOT ISBLANK (
                SELECTEDVALUE ( 'SortedHierarchyTable'[Concept 3] )
            ), SELECTEDVALUE ( 'SortedHierarchyTable'[Concept 3] ),
        ISINSCOPE ( 'SortedHierarchyTable'[Concept 2] )
            && NOT ISBLANK (
                SELECTEDVALUE ( 'SortedHierarchyTable'[Concept 2] )
            ), SELECTEDVALUE ( 'SortedHierarchyTable'[Concept 2] ),
        ISINSCOPE ( 'SortedHierarchyTable'[Concept 1] )
            && NOT ISBLANK (
                SELECTEDVALUE ( 'SortedHierarchyTable'[Concept 1] )
            ), SELECTEDVALUE ( 'SortedHierarchyTable'[Concept 1] ),
        "TOTAL"
    )
VAR currentItemValue =
    IF (
        currentItem = "TOTAL",
        COUNTROWS ( 'SortedHierarchyTable' ),
        CALCULATE (
            COUNTROWS ( 'SortedHierarchyTable' ),
            'SortedHierarchyTable'[Concept] = currentItem
        )
    )
VAR result =
    SWITCH (
        TRUE (),
        ISINSCOPE ( 'SortedHierarchyTable'[Concept 3] )
            && ISBLANK (
                SELECTEDVALUE ( 'SortedHierarchyTable'[Concept 3] )
            ), BLANK (),
        ISINSCOPE ( 'SortedHierarchyTable'[Concept 2] )
            && ISBLANK (
                SELECTEDVALUE ( 'SortedHierarchyTable'[Concept 2] )
            ), BLANK (),
        currentItemValue
    )
RETURN
    result
And indeed the desired result
Now, just when I thought I was done, the customer said «wait it’s not showing in the order that we specified at the «Order» column, and indeed she had a point (strawberries should be the first berry for instance). Remember:
«Fear not, I’ll fix that in no time» I assured. So I proceeded to create a «Order 1» column like
Order 1 =
LOOKUPVALUE (
    SortedHierarchyTable[Order],
    SortedHierarchyTable[Concept], SortedHierarchyTable[Concept 1]
)
(and I was so sure it would work that I did the same for Concept 2 and 3…)
Well well well, the thing happened when I tried to actually sort the Level 1 column by my Order 1 column. At that point Power BI said it would not do it because of a circular reference error.
WHAT?? At first I thought it was because it all happened too much on the same table, so I set a calculated table just with the items and their order, did the lookup on that table, exactly the same result.
SortedHierarchyTable for Order 1 =
SELECTCOLUMNS (
    'SortedHierarchyTable',
    "Concept", [Concept],
    "Order", [Order]
)
What the French Toast would Patrick say. I did manage to sort it if I connected my report table to a copy of it using Concept 1 item, but that was way too bad, as I would need 3 calculated tables just to sort a hierarchy?!?
There must be a better way.
After a cool down period on my own (all this had happened while the customer was watching of course) a ray of light broke through the clouds of my head:
«Why don’t you do the same that you did with the Concept but with the order number?«
Hey, that could work. So there we go:
First of all I created a «Parent Order» column like
Parent Order =
LOOKUPVALUE (
    'SortedHierarchyTable'[Order],
    'SortedHierarchyTable'[Concept], 'SortedHierarchyTable'[Parent Concept]
)
Then
Order Path =
PATH (
    'SortedHierarchyTable'[Order],
    'SortedHierarchyTable'[Parent Order]
)
And of course (for 1, 2 and 3)
Order 1 =
PATHITEM ( Report[Order Path], 1, NUMBER )
Important here to specify it is a number on the third argument!
And now taking column «Concept 1» and doing Sort by Column «Order 1» worked beautifully as well as for 2 and 3. And so the matrix looked as it should!
Not life-changing maybe, but good to know at any rate.


