Calculating the percentage of targets reached

After a long break due to a truckload of presentations (for my standards) here I’m back again with the blog.
I have a pile of ideas, but always the latest idea takes priority as it is hot, it’s burning in my head.
A guy from the Barcelona Power BI User Group asked me if calc groups could help him in a measure he was running. It’s like a measure of measures. There are several measures that represent different organizational KPIs, and they have a disconnected table in which there’s a target for each measure. He wants to know the percentage of targets that were met.
With standard DAX there’s not much you can do beyond pulling the target from the table, comparing it to the measure value and then add 1 to the targets met. The problem is that you can’t call measures dynamically, you have to type the measure with the square brackets and all. A string will not do it.
However… with Calc Groups it’s a different story! The dynamic measure calc group by Greyskull Analytics does exactly this. Depending on the calc item, a different measure is returned. And not just the value, it returns *the measure* so it can be used even inside other calc groups and these calc groups will believe they are seeing the new measure.
So let’s do it!
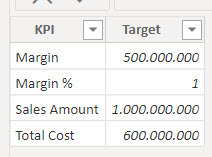
First of all I set out a very basic target table for Contoso on 2008
And then I did write the «Targets Reached» measure with regular DAX
Targets Reached =
VAR marginTarget =
    LOOKUPVALUE ( 'Targets'[Target], 'Targets'[KPI], "Margin" )
VAR marginPctTarget =
    LOOKUPVALUE ( 'Targets'[Target], 'Targets'[KPI], "Margin %" )
VAR salesAmountTarget =
    LOOKUPVALUE ( 'Targets'[Target], 'Targets'[KPI], "Sales Amount" )
VAR totalCostTarget =
    LOOKUPVALUE ( 'Targets'[Target], 'Targets'[KPI], "Total Cost" )
VAR targetsReached =
    IF ( [Margin] >= marginTarget, 1 )
        + IF ( [Margin %] >= marginPctTarget, 1 )
        + IF ( [Sales Amount] >= salesAmountTarget, 1 )
        + IF ( [Total Cost] >= totalCostTarget, 1 )
VAR numTargets =
    COUNTROWS ( 'Targets' )
VAR result =
    DIVIDE ( targetsReached, numTargets )
RETURN
    result
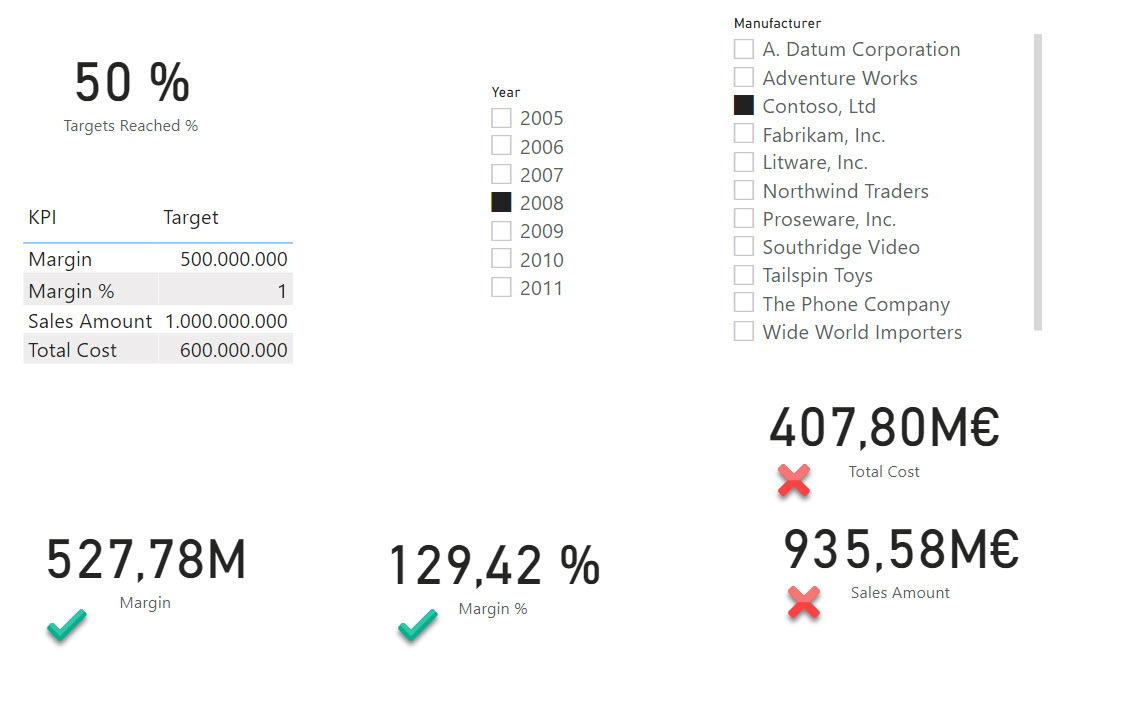
And indeed it shows that only 50% of targets where reached
But as Alberto Ferrari would say, «Can we do better?»
indeed this approach is not wonderful, especially if we have to do it for 20 KPIs or so.
Let’s try it the Calc group way™.
We grab the script from Greyskull Analytics, and run it selecting all four measures. Of course I have it on my Macro toolbar. I get rid of the extra measures the script creates as I will not be using them. The calc Group looks like this
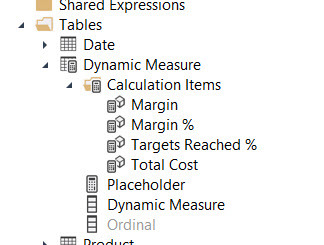
Each of the items is quite simple
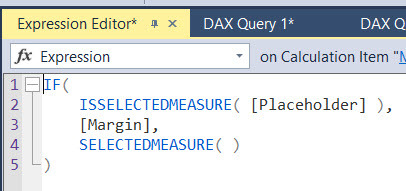
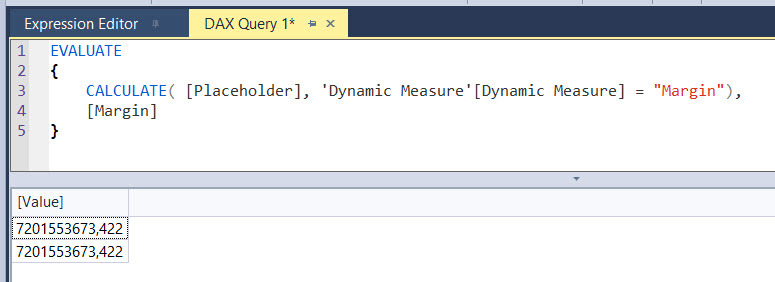
Although in general I do not recommend the approach, you can use calc group inside DAX expressions, such as CALCULATE. We can then indeed, refer to a measure by its name. The two expressions are equivalent.
We almost have it then!
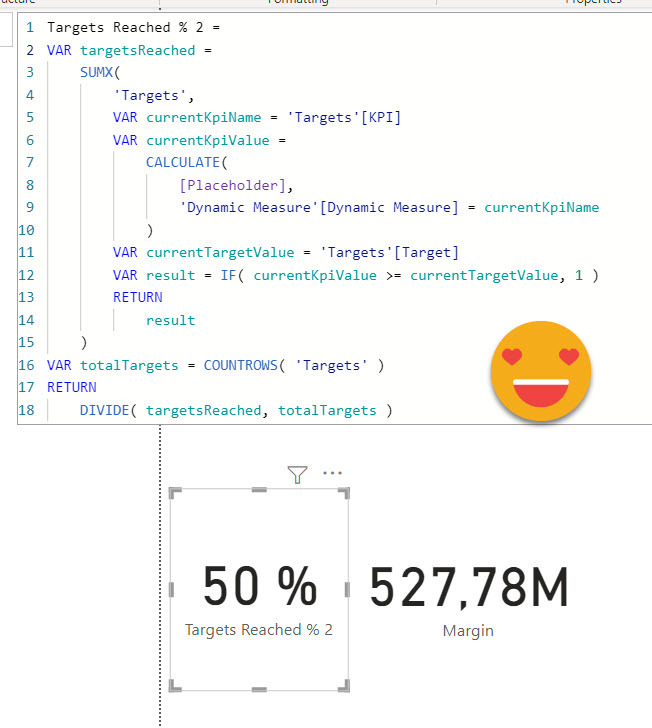
I was careful to create the Target table with the exact same names as the measures, so we can indeed iterate over it
My first try is to go step by step and get the number of targets reached, but this expression is not allowed
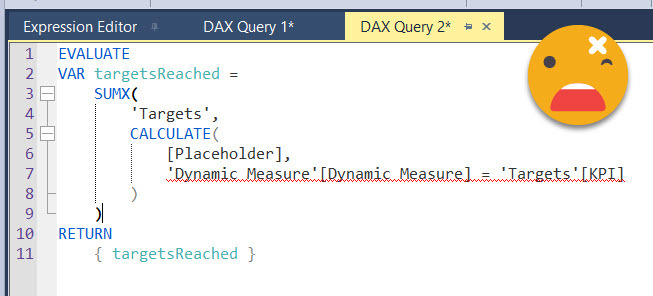
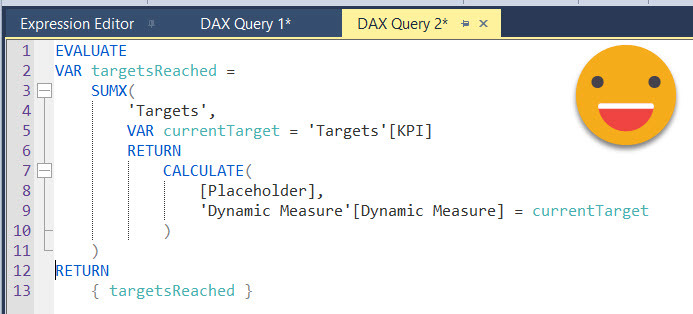
You can’t use columns from different tables in true/false statements, for some reason. Oh well. Since we do have a row context over Targets table, we can just store the value in a variable and use that instead
Of course at this point the expression basically adds the value of all 4 measures which is nonsense, but hey, we’re getting closer. From this point I just type some more DAX and get to this point.
EVALUATE
CALCULATETABLE (
    VAR targetsReached =
        SUMX (
            'Targets',
            VAR currentKpiName = 'Targets'[KPI]
            VAR currentKpiValue =
                CALCULATE ( [Placeholder], 'Dynamic Measure'[Dynamic Measure] = currentKpiName )
            VAR currentTargetValue = 'Targets'[Target]
            VAR result =
                IF ( currentKpiValue >= currentTargetValue, 1 )
            RETURN
                result
        )
    VAR totalTargets =
        COUNTROWS ( Targets )
    RETURN
        { DIVIDE ( targetsReached, totalTargets ) },
    'Date'[Year] = 2008,
    'Product'[Manufacturer] = "Contoso, Ltd"
)
Here is important the use of the row context to get both the KPI name and Target value of the row, and we use the KPI name to get the measure value, which is the thing that you only can do with a calculation group. From there it’s all downhill. Here you can see I wrapped everything in a CALCULATETABLE where I place the two filters I have on the report, so I can check if I’m getting the correct value, and indeed I am!
So as a measure the code is quite more compact — as it is the same for 4 or 1000 measures. No word on how would that perform with a 1000 measures, but that’s another story. Calling measures by name has probably more applications too!