Incrementally load from SAP, APIs or almost anything

Ok, so today there are no calculation groups in place, but I want to explain a technique to use incremental refresh even when your source does not support query folding as we normally understand it. Let me explain myself: In general the only use case that is widely documented for incremental refresh is when you load from a relational database that has a static date column (such as creation date of the record). You create your RangeStart and RangeEnd datetime parameters and off you go. And if you only read from your beautiful DWH, lucky you, no need to read further.
In the real world (at least the one that I know) people want to retrieve data from SAP, like a lot. I don’t really understand this SAP thing, but basically they keep scrolling adding columns with weird icons next to it until it’s all in. However, if they try to retrieve too much info, the query fails. So what is to be done?
If your refreshes are taking too long, or if they crash when you want to retrieve too much information, you need to start thinking on incremental refresh. But SAP is not like a relational database. If your original query retrieves all available records, and in later steps you filter to keep only the records between RangeStart and RangeEnd, chances are that the M engine will retrieve all the records (if it can) and then will keep just those that fit the condition. You get the worst of both worlds: slow refresh and an incremental policy which (as of Jan 2022) forbids you from downloading the pbix (or is it peebix?) file to your machine.
The main takeaway of this post is that to do incremental refresh, you do not need to have a query-folding enabled source, you need a little less than that, a source that allows you to retrieve data from certain time range only. You don’t even need to have a datetime column on the source (a requirement often stated when setting up incremental refresh).
The strategy that we will follow is
- Make a query to the source retrieving a manageable amount of information (say info from december 2021)
- Analyze in which part of the query (the actual call to the source) is the period encoded and how (maybe it’s something like «blababla 2021_12 blablalba » somewhere)
- Create a string type parameter called «Period» (or whatever you like) and give it the value that it has in your query (this would be 2021_21)
- Replace the period of the query by our new parameter (something like «blababla » & Period & » blablalba «)
- Right-click our query and select «Convert to function» (say getDataFromPeriod or something like that)
- Create RangeStart and RangeEnd Parameters and two queries that return their values as date (like StartDate and EndDate)
- Create a query that contains all the dates from StartDate to EndDate
- Modify the query until it has a the original date column and a column with the format required for Period.
- Remove duplicates, so that we have only different Periods
- Add filtering on the original date column using RangeStart and RangeEnd so that PowerBI allows you to configure incremental refresh (it will really not filter out anything)
- Add a column using the function defined on step 5, taking Period column value as argument
- Expand the table and do any transformations you need
- Configure incremental refresh!
I’m not sure who is the first that came up with this idea, but certainly it wasn’t me. I learned from Carles Rubinart, my boss at the customer side, great guy. So, don’t worry, we’ll now go step by step and see how this plays out.
One thing that took me a while when preparing this article was to find some free API or dataset to use that had some historical data and you could get data from a single period. The one I found maybe it’s not great, but the principle stands. I’m sure Ruth Pozuelo from Curbal would come up with much better data sources! Anyway, I found a resource to get the trees in Barcelona, because why not?.
So let’s start from the beginning once again:
1. Make a query to the source retrieving a manageable amount of information
The query has a very simple structure: to get the data for the fourth quarter, the URL is:
https://opendata-ajuntament.barcelona.cat/resources/auto/trimestral/2021_4T_OD_Arbrat_Zona_BCN.json
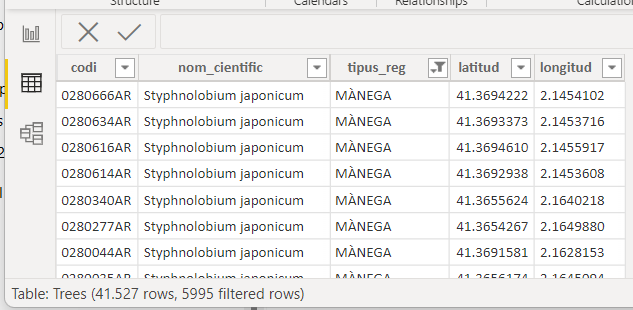
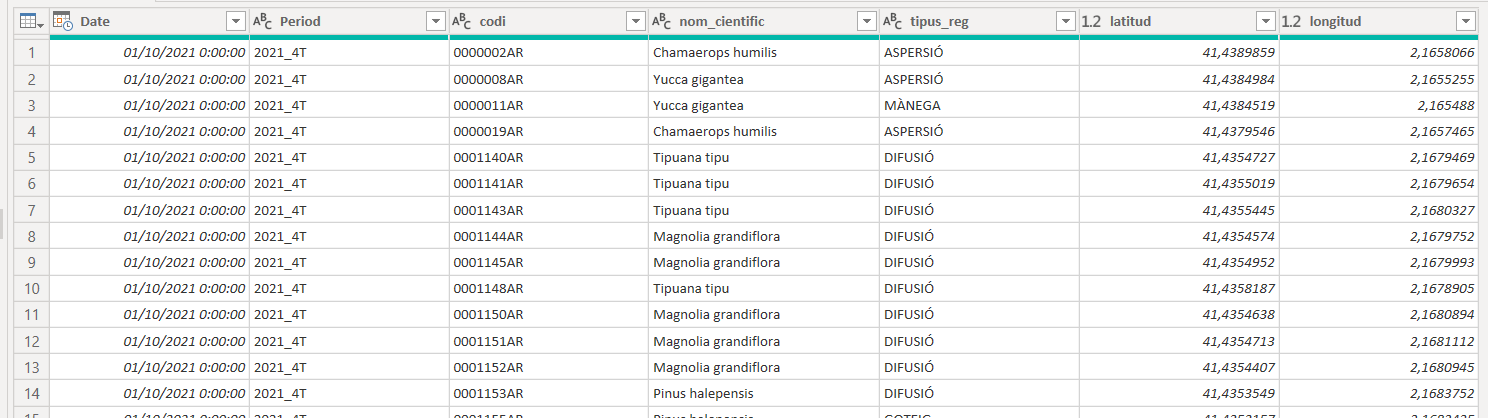
And indeed, if you use the web connector it will understand it is getting a JSON file and return a record list. With very simple steps we get a nice table (I only included a few fields for clarity)
let
    Source = Json.Document(Web.Contents("https://opendata-ajuntament.barcelona.cat/resources/auto/trimestral/2021_4T_OD_Arbrat_Zona_BCN.json")),
    #"Converted to Table1" = Table.FromList(Source, Splitter.SplitByNothing(), null, null, ExtraValues.Error),
    #"Expanded Column1" = Table.ExpandRecordColumn(#"Converted to Table1", "Column1", {"codi", "nom_cientific", "tipus_reg", "latitud", "longitud"})
in
    #"Expanded Column1"
looks like an ID for the tree, scientific name, type of watering, latitude and longitude. Fair enough.
Since we might be doing an study of what happens with the trees throughout the years (increse? decrease? where? changes in watering system? improvement in data quality? ) we want to retrieve all the available snapshots. So we go to the next point
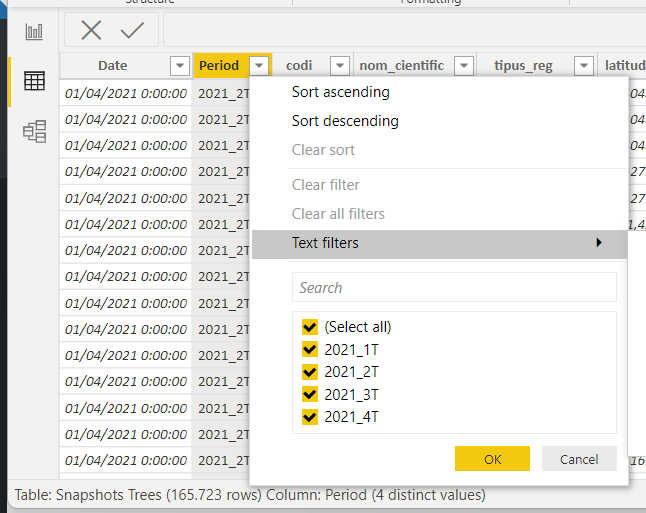
2. Analyze in which part of the query (the actual call to the source) is the period encoded and how
If we look again at our query to the source, it’s just a plain URL and the period is part of the json file name, so it’s quite easy to spot. In our case information is quarterly («4T» is equivalent to «Q4» in english)
https://opendata-ajuntament.barcelona.cat/resources/auto/trimestral/2021_4T_OD_Arbrat_Zona_BCN.json
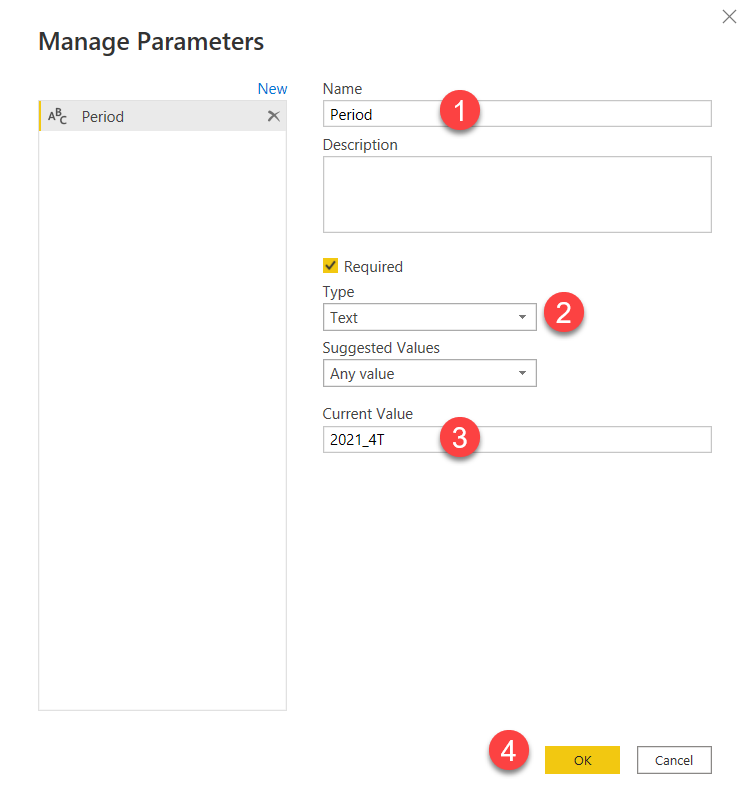
3. Create a string type parameter called «Period» with the same value
That’s an easy one.
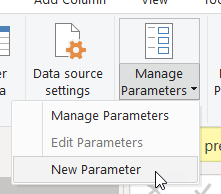
We go to Manage Parameters → New Parameter
And we give a name (1), specify it’s text type (2), we give it the value «2021_4T» (without quotes) identified previously identified (3), and we click ok (4)
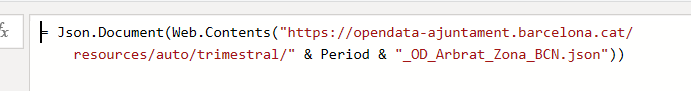
4. Replace the period of the query by our new parameter
So now, instead of a hard-coded period, we want our query to use our new parameter. Apparently that’s pointless, but you’ll see it’s not in a moment.
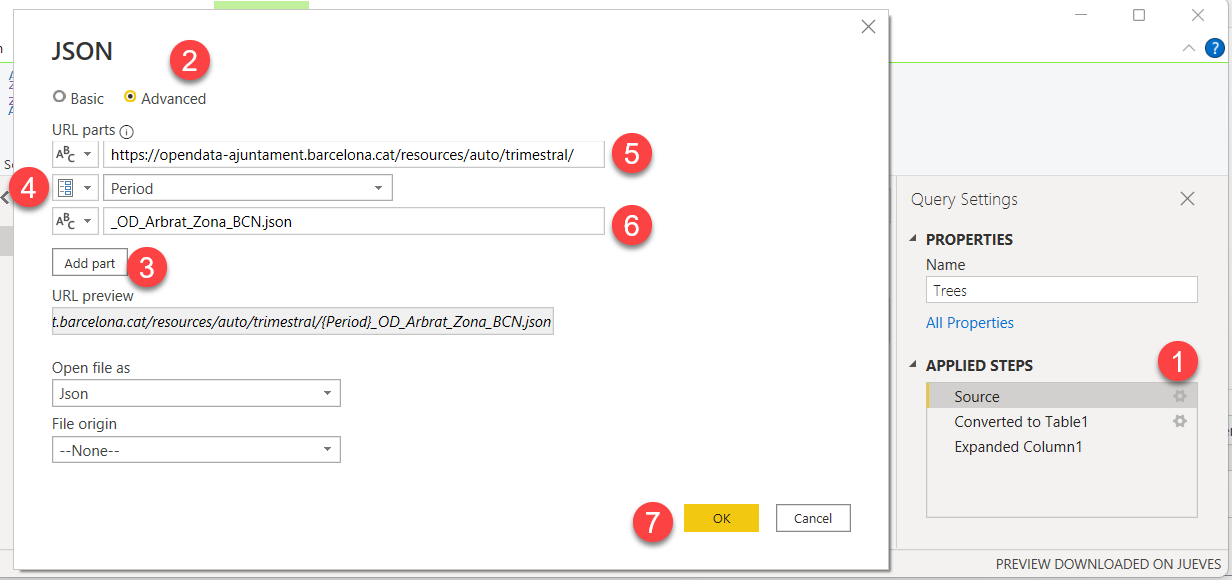
Power Query even provides a nice interface to accomplish that. Click on the gear icon of the source step in our query (1), click on advanced (2), click on Add Part (3), change the type of the 2nd part to parameter (4) if you have only one it will automatically selected, otherwise select the period one. Then go to the first part of the URL (which still has it all) and cut away the period and everything that comes after it (5), paste it on the third part of the URL and remove the hard coded period to keep only the text that comes after it. Click Ok (7).
As you can see, this is mostly a fancy way to concatenate hard coded strings with parameters.
For SAP queries you do not get such niceties and you’ll have to do it through the advanced editor. Be aware that the period may appear more than once in the query!
Anyway, if you did everything fine, you should still be seeing your same records.
5. Right-click our query and select «Convert to function»
This is a very literal step. Just do what it says and magic happens
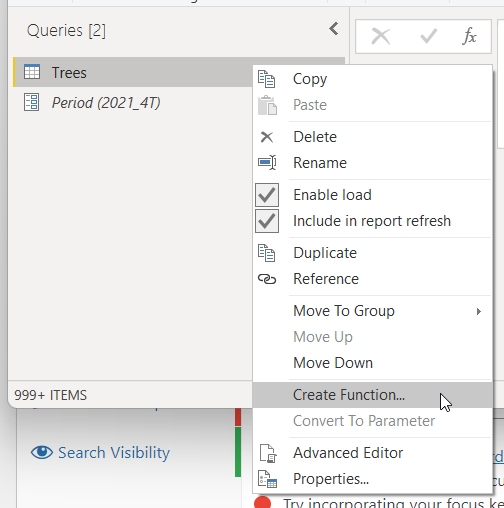
Just give the function a name (1) and click «OK» (2)
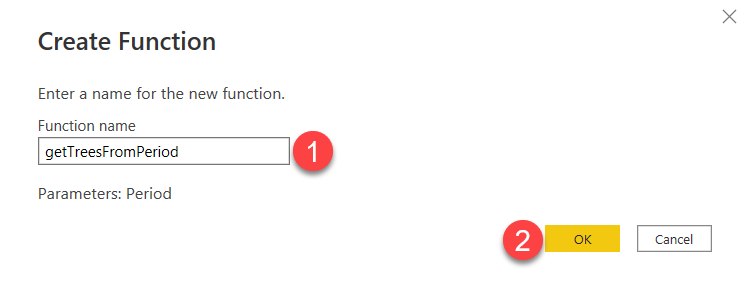
And bam, we just created a function, isn’t that cool?
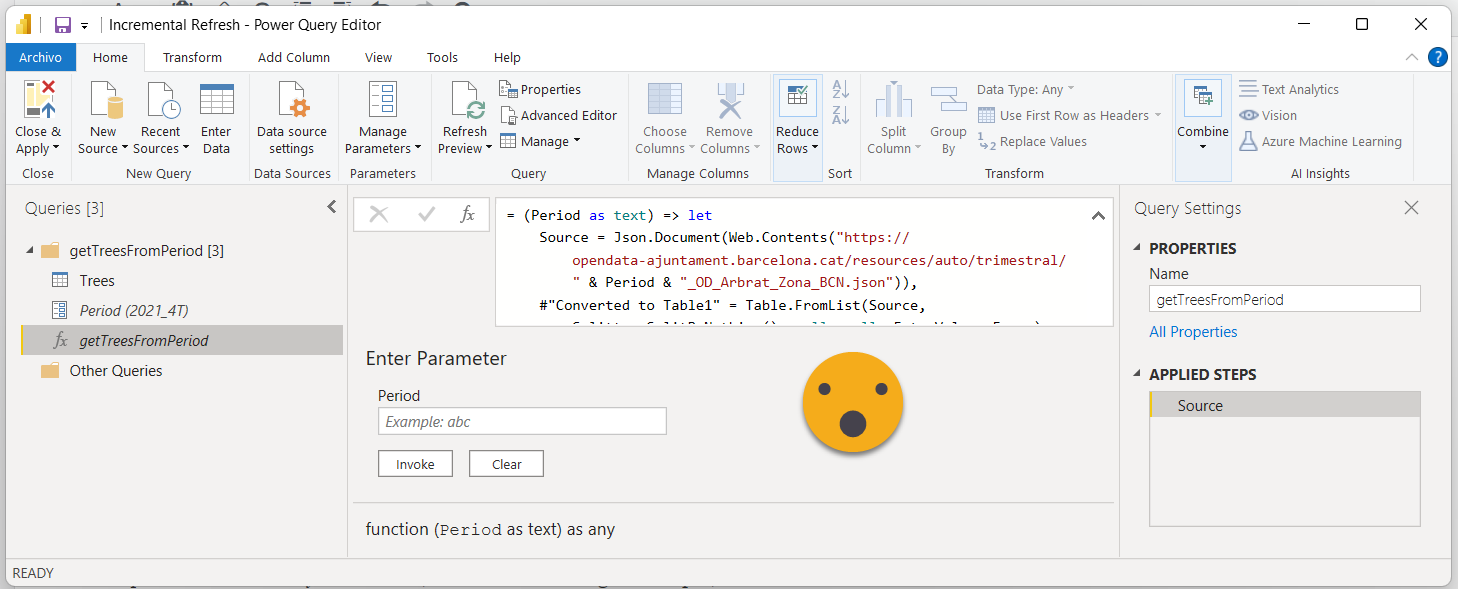
Update 2022-01-18: I received some feedback from Ignacio Barrau (who also has a great blog in Spanish) saying that this will not work on the service, and that we need to use the relative path parameter explained by Chris Webb on his blog.
6. Create RangeStart and RangeEnd Parameters and two queries that return their values as date
The second part of this step does not really make sense, but I haven’t managed to skip it, so let’s just do it all. Creating the parameters should not be a big deal — exactly as the one for period, but this time the value should be 01/10/2021 and 31/12/2021 (if you use dd/mm/yyyy settings in your machine) the time part will be automatically completed.
To create the two queries just go to New Source → Blank Query
![]()
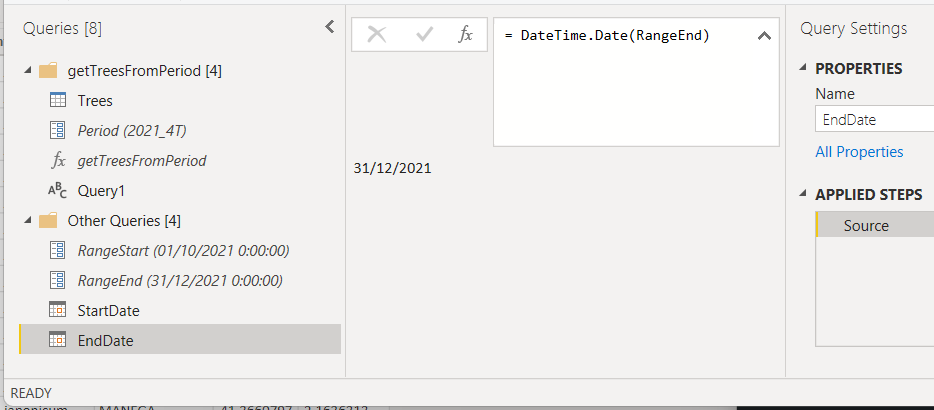
Then go to the formula bar and type
=DateTime.Date(RangeStart)
Rename the query «StartDate». Repeat the steps for RangeEnd and query name «EndDate»
Update (2022-01-22): If you are attempting to build this technique in a Power BI Dataflow, be very careful. Unless it has been fixed, when you activate incremental refresh on a dataflow table, if you already have RangeStart and RangeEnd defined, it causes a fatal error in which you can no longer open your dataflow. It complains of duplicate parameter names. Indeed when you activate incremental refresh on a dataflow, the parameters get created automatically, so do that first, just so that you’ll get the parameters created by the dataflow, and you avoid the error. Afterwards you can use the parameters in as regular parameters. The only quirk is that it will move the filtering step to the end of the query, but you can make a copy of the step in any position you want.
7. Create a query that contains all the dates from StartDate to EndDate
This is probably the trickiest step if you are, like myself, not a PowerQuery jedi. Actually I did not remember how it was while writting this blog, so once again I looked it up and remembered there’s a function that does just this.
From there we just need to calculate the «count» of items in the list to define it, and bam, here’s what we should write
= List.Dates(StartDate,Duration.Days(EndDate - StartDate)+1, #duration(1,0,0,0) )
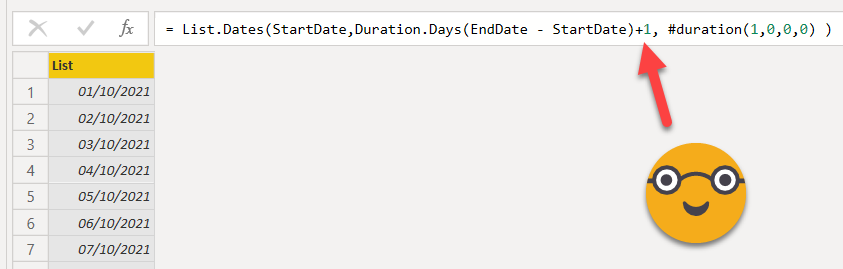
Important not to forget the +1 to get the RangeEnd date in the table.
8. Modify the query until it has a the original date column as datetime and a Period column with the format required for Period
This will look different for the format that you need, but should not be too diferent from what we’ll do here.
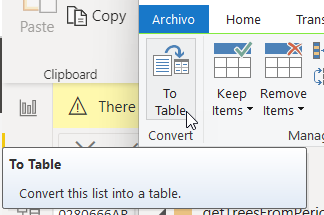
Convert to table and leave the default settings
We now rename the column to «Date» and the type to Datetime (because you need a datetime column to set up incremental refresh.
To create the period column, we go to the «Add Column» ribbon tab → Custom Column
There’s probably a ton of ways to achieve what we want to do, but I found this one. It’s important to remember that PowerQuery is very picky about types, and does not let you concatenate numbers and strings, so you have to lay everything up very nicely for it to do its thing.
= DateTime.ToText([Date],"yyyy") & "_" & Number.ToText(Date.QuarterOfYear([Date]),"0") & "T"
Convert the column to text and we should now have two nice columns
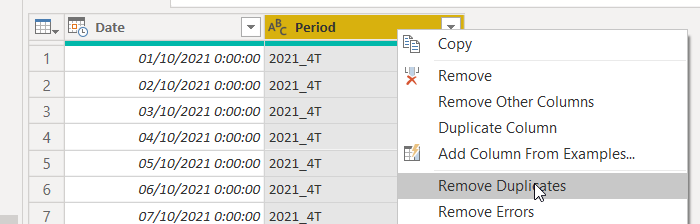
9. Remove duplicates, so that we have only different Periods
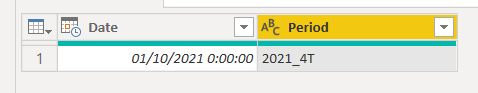
Here is important to end up with only distinct values in the period columns, but we also need to think on the filtering condition that we’ll be using (so that Power BI let’s us set up incremental refresh). Since probably data is not available on the very first day of the quarter, we’ll include RangeStart and we’ll stop right before RangeEnd. In that case we can just remove duplicates as is, and it will keep the first date next to our period.
Before:
After:
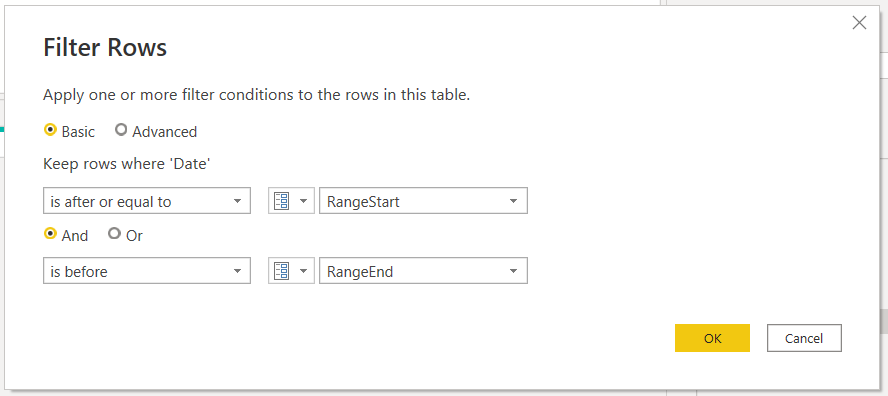
10. Add filtering on the original date column using RangeStart and RangeEnd
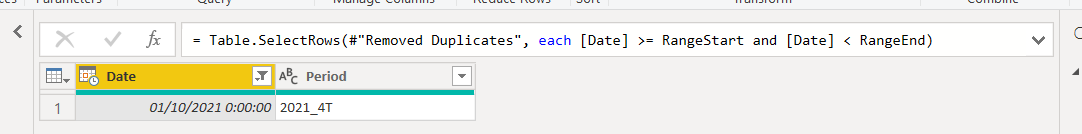
Here it will make sense what I was talking about the previous point. We need to set up the filter in a way that this row stays! If your condition is > RangeStart you’ll end up with zero rows, so we’ll set up to greater or equal to RangeStart and strictly smaller than RangeEnd.
if all is good you still have your row:
Depending on the logic and when de data becomes available, you might want to sort your dates in descending order before removing duplicates so you’ll keep the latest date with the period. In such case you’ll modify the filtering to keep the row.
I know what you might be thinking — «Bernat, I don’t want just this quarter, I want all of them!» I know the feeling, but don’t worry, we’ll be testing if it can load more than one quarter successfully soon and in any case the values of RangeStart and RangeEnd will be managed by Power BI Service once we set up the incremental refresh.
Update (15-01-2022 after posting): A word of caution on large granularities and daily refreshes! The date column where we place the filter is our incremental key — therefore if we end up with a different date but the same Period, we’ll get duplicates (or worse) in our dataset. The example continues as is with the check of refreshing only whole quarters (which should be fine?), but I think it would be better to place the filter on a custom column that contained the first day of the quarter for each Date. this way you’ll always get the same date-and period and the incremental refresh will certainly delete the existing record before entering the new ones as it should. The column can be added with
= Table.AddColumn(#"Changed Type", "Start Of Quarter", each Date.StartOfQuarter([Date]))
At the same time I realized that this technique is useful to get snapshots of a source. Refreshing only the last date, and using a function without parameters (or at least without a period parameter).
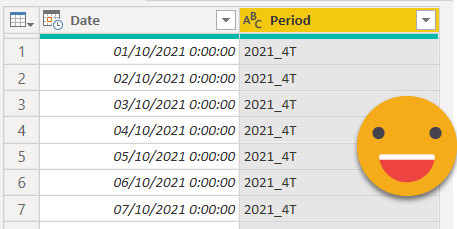
11. Add a column using the function defined on step 5, taking Period column value as argument
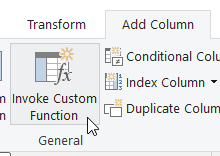
Now you’ll see the point of everything we’ve done so far. Go to Add Column → Invoque Custom Function
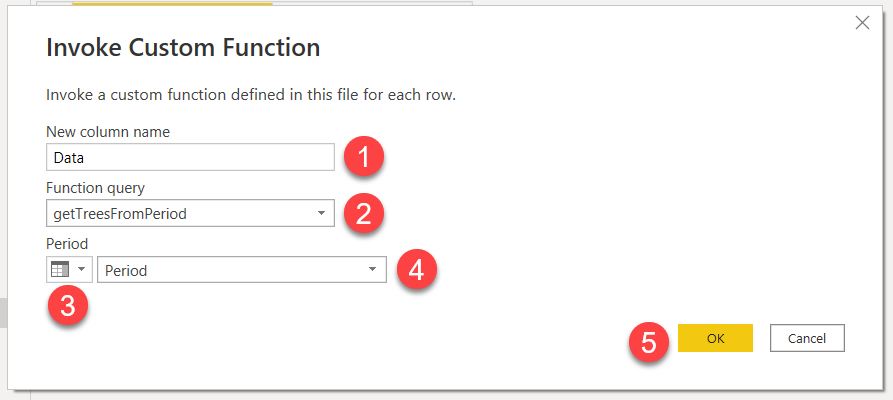
In the dialog that appears, first give a name to the column that will be created (1). It’s not really relevant, but I think it’s better «Data» than just «Custom». Then select the function from the Function query dropdown (2). Then specify that the value for the «Period» parameter of the function should come from a column (3) and in the drowpdown next to it specify that it’s the «Period» column the one that contains the value that should be used for each row. Then click OK (5).
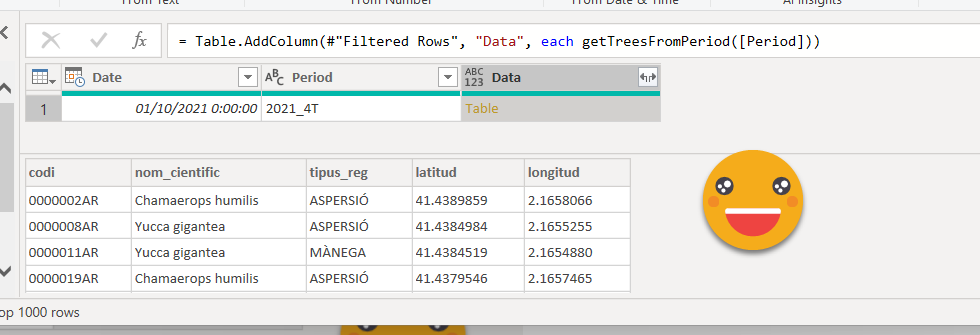
If all is good we should get a new column called «Data» and its content should be a table! if you click on the cell of the new column — on the white space not the word! — you’ll see the contents of the table, which are indeed the same of the very first query we did!
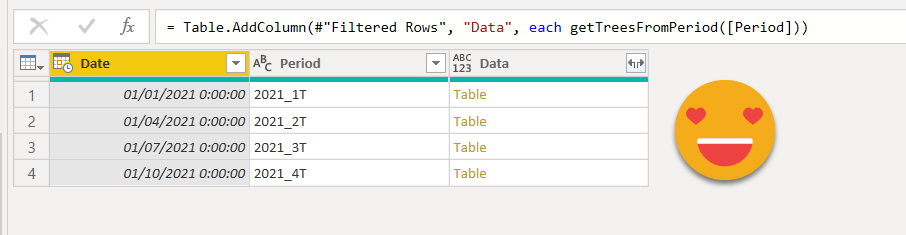
At this point we can do the fire test, and that is — save your work before that! — try to enlarge our range and see if we get more such tables!
Let’s change RangeStart to 01/01/2021 and go back to our Query (I called mine Snapshots Trees by the way). You might get a Privacy warning thing. Set it up or select ignore and you are good to go.
It might be a good idea to disable load from this query and make two relationships from it. In one you remove errors from the Data Column, while in the other you keep errors from the data column. This way you get a robust loading process and awareness if anything is wrong/missing. But getting into more detail would make this already long post into something even more unbearable so I’ll stop here on this front.
12. Expand the table and do any transformations you need
To get faster response I would recommend moving back to 1 quarter of data only. And then we can finally Expand Columns! This will happen for all periods once this is in the service and refreshing. I just expanded the columns (without prefix) and set the correct data types. You can delete the period column (not the date column!), or leave it if you so desire (← Adam Saxton voice here)
Before you close and apply changes: Check that your original query has disable load, and also the StartDate and EndDate queries have also disabled loading. I know a guy who did not check that.
As a proof that it does load the data, with the proper RangeStart and RangeEnd values (which will be done in the service, incrementally) this dataset was pretty small so I took the whole year and yes, it did work. You can see I have plenty more rows too.
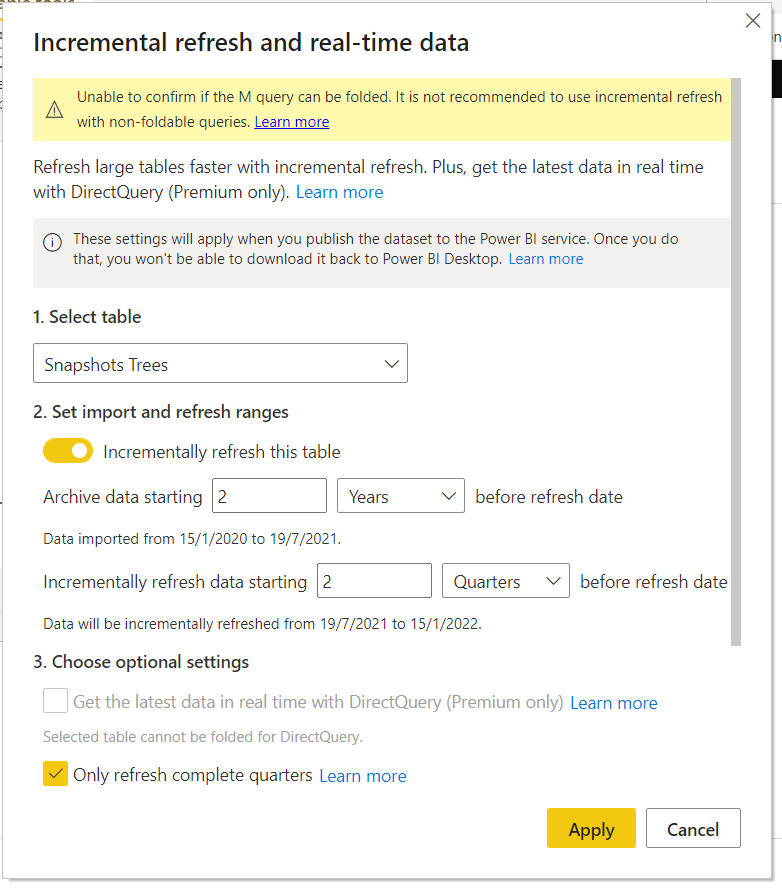
13. Configure incremental refresh!
The time has come! Just configure as you would always, even if you read from a pristine DWH. If you are new to incremental refresh, just go inside Power BI Desktop, in the report view is fine, right lick on the table that you want to incrementally refresh and click on «Incremental Refresh». This dialog will show up.
Update 2021-01-18: Ignacio Barrau also correctly pointed out that for this example this will fail because for 2020 the dataset does not follow the same schema and/or format. Check your source and if you are lucky you can skip reading this paragraph. Otherwise you might need to load historical data in chunks for each format, shape it into a common schema and then append it all inside power query. In such cases though you need to apply filtering in all the tables that you will append — the resulting table should be only the data that needs to be refreshed! then power bi will look at the date column of what you had loaded in previous refreshes and delete anything that falls into the refresh period and append it with what you get for the RangeStart-RangeEnd values (you can test that with Power BI Desktop)
And that’s it! or is it?
Depending on your source and data volume you might get an out of memory or a timeout on the initial refresh of the service. In that case you’ll need some smart workaround that Patrick showed a while back. For that you’ll need XMLA access, so yes, premium. I hope you get through it.
I’ve used it for real and yes, it’s possible to do incremental refresh with non-foldable data sources. As long as you can retrieve only a period of the information, it’s possible. You won’t be able to incrementally refresh from a huge csv file (of course) but it can help if you work with sources such as SAP or APIs.
Now it is the end. If you read all the way, kudos to you, really.
Write a comment here (we fixed the capcha thing!) or on the post announcements in Twitter and LinkedIn