Creating a dynamic KPI card

I’m always keep an eye open for potential new members of the Barcelona Power BI User Group. When I see a potential candidate I try to connect and get to know him/her. Today I was surprised that one of these unsuspected new members told me he was already using my script for Time Intelligence (yay!) and followed with a question on calc groups (double yay!). He was trying to build a KPI card which used a measure as the main KPI and wanted to use the previous year value as target, and was struggling to apply the calculation group just to the target one. I gave it some thought and I think the final set up might be useful to more people, so here I come.
First I thought about creating different measures and apply the calculation group via DAX, but that’s sad. Sad because you loose the dynamic format string part, and the possibility to show different measures on one card via slicer. So I thought again. And a little more. Then I realized that is a similar use case when you want to apply conditional formatting with calculation groups, you need two dynamic measures that behave like twin brothers (or sisters?) and then ZUM! you modify just one of them for your formatting desires and keep the other intact to show the value. In this case we’ll modify one to show Previous Year (PY) while the other one shows the measure with no modifications (Current Year or CY). We just need to include one of the measures –and not both– in the list of measures affected by the time intelligence calc group.
If you want to see how this plays out, keep reading. At the end we’ll see how to apply YTD to the main measure and PYTD to the secondary one as well, which is a bit trickier.
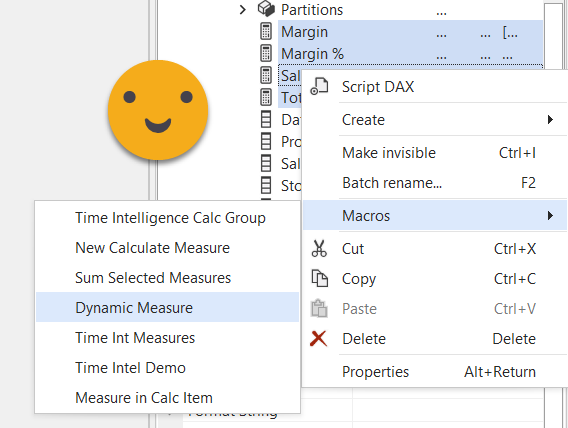
First of all, we’ll get our good old Contoso model and create a dynamic measure calc group with our usual 4 measures. (you can get the script of the macro and learn how to use it in this blog post)
We should get something like this (removed additional measures of the calc group for clarity)
-------------------
-- Measure: [Dummy]
-------------------
MEASURE 'Dynamic Measure'[Dummy] = BLANK()
    Description = "Control the content of this measure by selecting values from Dynamic Measure."

---------------------------------------
-- Calculation Group: 'Dynamic Measure'
---------------------------------------
CALCULATIONGROUP 'Dynamic Measure'[Dynamic Measure]

    CALCULATIONITEM "Margin" =
        IF(
            ISSELECTEDMEASURE( [Dummy] ),
            [Margin],
            SELECTEDMEASURE( )
        )
        FormatString =
            IF(
                ISSELECTEDMEASURE( [Dummy] ),
                "$ #,##0.00",
                SELECTEDMEASUREFORMATSTRING( )
            )

    CALCULATIONITEM "Margin %" =
        IF(
            ISSELECTEDMEASURE( [Dummy] ),
            [Margin %],
            SELECTEDMEASURE( )
        )
        FormatString =
            IF(
                ISSELECTEDMEASURE( [Dummy] ),
                "#,##0.00 %",
                SELECTEDMEASUREFORMATSTRING( )
            )

    CALCULATIONITEM "Sales" =
        IF(
            ISSELECTEDMEASURE( [Dummy] ),
            [Sales],
            SELECTEDMEASURE( )
        )
        FormatString =
            IF(
                ISSELECTEDMEASURE( [Dummy] ),
                "$ #,##0.00",
                SELECTEDMEASUREFORMATSTRING( )
            )

    CALCULATIONITEM "Total Cost" =
        IF(
            ISSELECTEDMEASURE( [Dummy] ),
            [Total Cost],
            SELECTEDMEASURE( )
        )
        FormatString =
            IF(
                ISSELECTEDMEASURE( [Dummy] ),
                "$ #,##0.00",
                SELECTEDMEASUREFORMATSTRING( )
            )
Now we’ll create a secondary measure that will be also affected by the calculation items, just like the [Dummy] measure.
Update 2022-05-15: This step is unnecessary if you use the new script that comes with three dummy measures out of the box
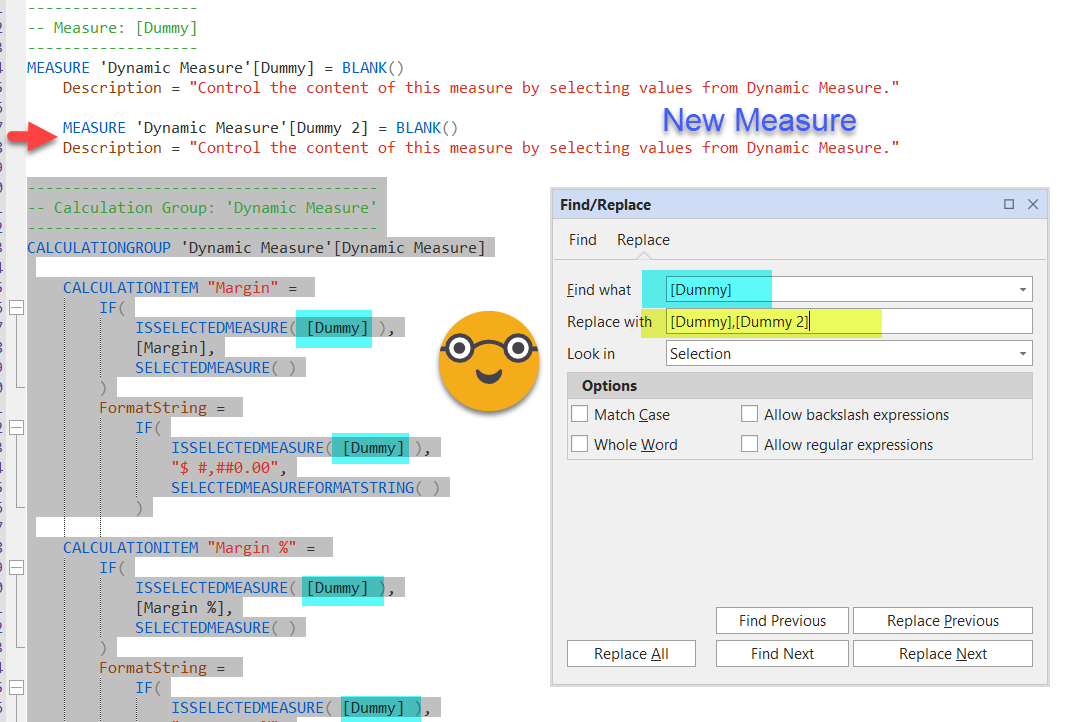
Well, even though you think you’ll be replacing just on the selection, it will replace on the whole script (there’s an open bug on this, so most likely will be fixed eventually) — just fix the code on the [Dummy] measure, or delete it altogether as we do not need to modify that part. Execute and we should be ready to go. If you are in Tabular Editor 2 add the measure and just modify manually each calculation item (value and format string expression)
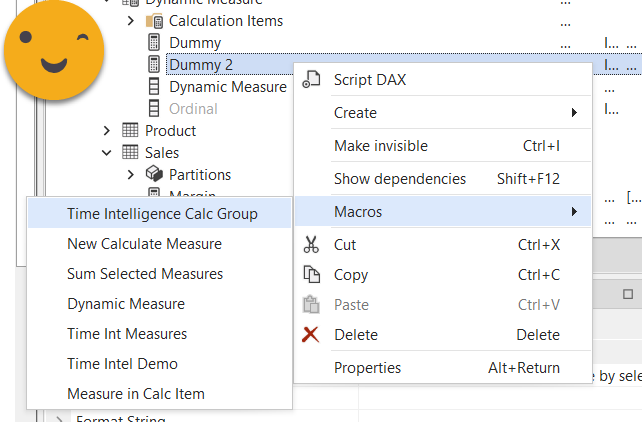
Ok, so now that we have the dynamic measure calc group we’ll build the time intel calculation group, selecting only [Dummy 2] — (you can get the code and learn how to use it in this blog post)
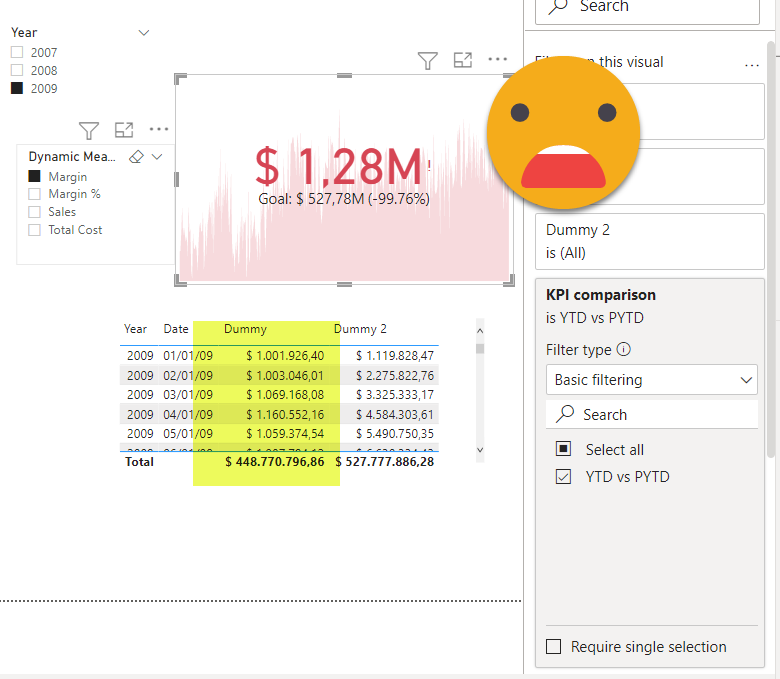
Now we save back to the model and set up the kpi card: [Dummy] as main measure, [Dummy 2] as target (for some reason called Trend in the visualization pane), I used date as «Trend Axis». Then I added the PY calc item at the visual level and added a filter by year to get some meaningful results. Oh and of course the Dynamic Measure slicer with the column from the Dynamic measure calc group.
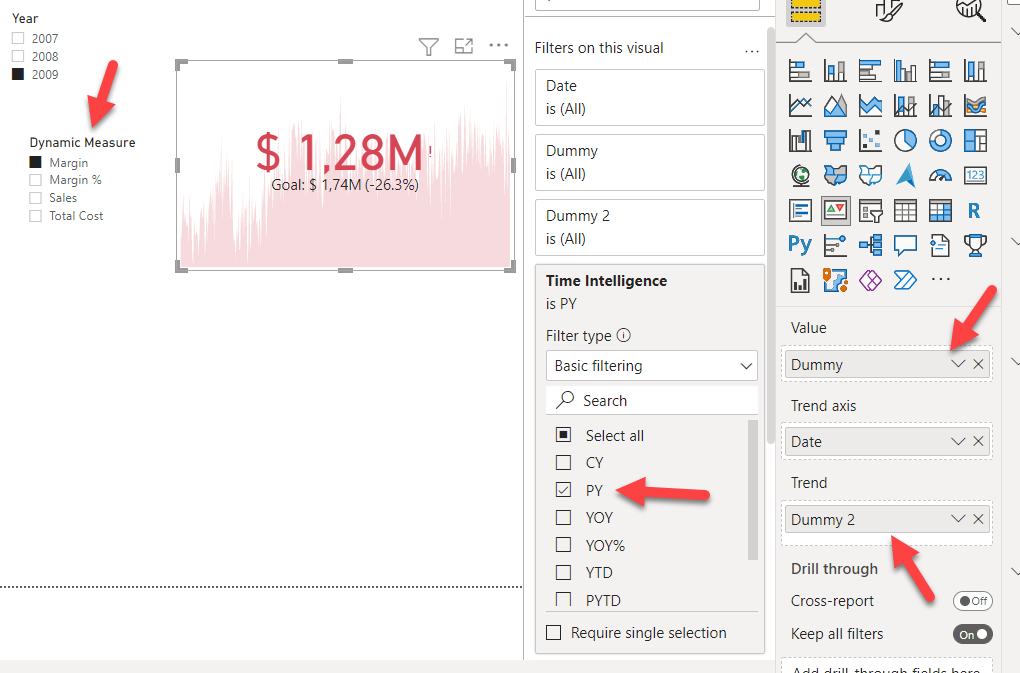
It took me a while to realize that the value shown is the latest value of the measure at the granularity specified by the axis. Since I used date the value are the sales from the last day and the goal the last sales from the previous year. That does not really make sense right? It would be much better to compare YTD with PYTD, but how can we do that? with our current approach we can only choose the calc item for one of the two measures. We need to someplace to say, apply YTD to [Dummy] and PYTD to [Dummy 2]… if 2 calculation groups is not enough, then a third one will certainly do it!
Actually it’s a fairly simple one. We’ll use it at the highest precedence and just go
--------------------------------------
-- Calculation Group: 'KPI comparison'
--------------------------------------
CALCULATIONGROUP 'KPI comparison'[KPI comparison]    Precedence = 2

    CALCULATIONITEM "YTD vs PYTD" =
        SWITCH(
            TRUE( ),
            ISSELECTEDMEASURE( [Dummy] ),
                CALCULATE(
                    SELECTEDMEASURE( ),
                    'Time Intelligence'[Time Intelligence] = "YTD"
                ),
            ISSELECTEDMEASURE( [Dummy 2] ),
                CALCULATE(
                    SELECTEDMEASURE( ),
                    'Time Intelligence'[Time Intelligence] = "PYTD"
                ),
            SELECTEDMEASURE( )
        )
        FormatString =
            SWITCH(
                TRUE( ),
                ISSELECTEDMEASURE( [Dummy] ),
                    CALCULATE(
                        SELECTEDMEASUREFORMATSTRING( ),
                        'Time Intelligence'[Time Intelligence] = "YTD"
                    ),
                ISSELECTEDMEASURE( [Dummy 2] ),
                    CALCULATE(
                        SELECTEDMEASUREFORMATSTRING( ),
                        'Time Intelligence'[Time Intelligence] = "PYTD"
                    ),
                SELECTEDMEASUREFORMATSTRING( )
            )
I just used the super-elegant approach that Owen Auger taught me with his feedback on my previous post.
When you apply a calculation group inside a calculation group expression, you can just use the same expression for value and format string, just change SELECTEDMEASURE() by SELECTEDMEASUREFORMATSTRING(). It’s so obvious that it’s glorious.
So we look all set right? Let’s see…
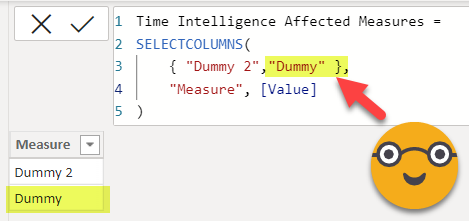
Auch. It’s not applying the YTD calc item… OF COURSE IT’S NOT we explicitly selected only [Dummy 2] and exclude [Dummy] from the effects of the time intelligence transformations of the calculation item. The good news is that we just need to modify the ‘Time Intelligence Affected Measures» calculated table and add the «Dummy» name and all calc items will work on the measure — both value and format string expressions. Quite handy. I rather do this change in PBI Desktop — creating new tables is an unsupported action that so far has caused me no problems (and Bravo does it as well so it’s rather safe), but modifying calc tables is another matter.
Let’s see now the report
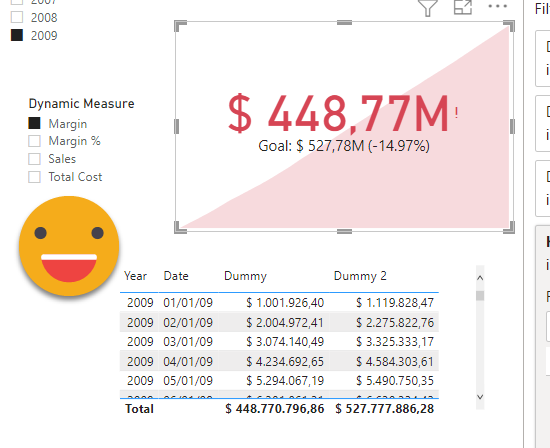
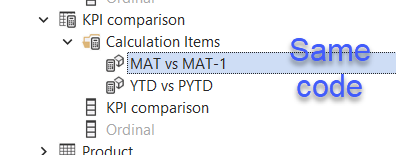
Much better! Now the line does not make much sense… Maybe it would be nice to see TAM vs TAM-1 ? Or even better, maybe we could give the user the ability to choose the pair of calculation items to compare! To make things a bit fancier we could even use the same code for all calc items and just extract the name of the calc items to use form the own calc item name… let me explain!
We can rewrite current ‘KPI comparison’ calc group like this
--------------------------------------
-- Calculation Group: 'KPI comparison'
--------------------------------------
CALCULATIONGROUP 'KPI comparison'[KPI comparison]    Precedence = 2

    CALCULATIONITEM "YTD vs PYTD" =
        VAR calcItem =
            SELECTEDVALUE(
                'KPI comparison'[KPI comparison],
                "No selection"
            )
        VAR delimiter = " vs "
        VAR vsPosition = FIND( delimiter, calcItem, 1, -1 )
        RETURN
            IF(
                vsPosition <> -1,
                VAR calcItem1 = LEFT( calcItem, vsPosition - 1 )
                VAR calcItem2 =
                    RIGHT(
                        calcItem,
                        LEN( calcItem ) - LEN( calcItem1 ) - LEN( delimiter )
                    )
                RETURN
                    SWITCH(
                        TRUE( ),
                        ISSELECTEDMEASURE( [Dummy] ),
                            CALCULATE(
                                SELECTEDMEASURE( ),
                                'Time Intelligence'[Time Intelligence] = calcItem1
                            ),
                        ISSELECTEDMEASURE( [Dummy 2] ),
                            CALCULATE(
                                SELECTEDMEASURE( ),
                                'Time Intelligence'[Time Intelligence] = calcItem2
                            ),
                        SELECTEDMEASURE( )
                    ),
                SELECTEDMEASURE( )
            )
        FormatString =
            VAR calcItem =
                SELECTEDVALUE(
                    'KPI comparison'[KPI comparison],
                    "No selection"
                )
            VAR delimiter = " vs "
            VAR vsPosition = FIND( delimiter, calcItem, 1, -1 )
            RETURN
                IF(
                    vsPosition <> -1,
                    VAR calcItem1 = LEFT( calcItem, vsPosition - 1 )
                    VAR calcItem2 =
                        RIGHT(
                            calcItem,
                            LEN( calcItem ) - LEN( calcItem1 ) - LEN( delimiter )
                        )
                    RETURN
                        SWITCH(
                            TRUE( ),
                            ISSELECTEDMEASURE( [Dummy] ),
                                CALCULATE(
                                    SELECTEDMEASUREFORMATSTRING( ),
                                    'Time Intelligence'[Time Intelligence] = calcItem1
                                ),
                            ISSELECTEDMEASURE( [Dummy 2] ),
                                CALCULATE(
                                    SELECTEDMEASUREFORMATSTRING( ),
                                    'Time Intelligence'[Time Intelligence] = calcItem2
                                ),
                            SELECTEDMEASUREFORMATSTRING( )
                        ),
                    SELECTEDMEASUREFORMATSTRING( )
                )
Here calcItem gets the name of the active calc item, then I just protect it a bit so that it does not break with a wrong name, and just extract both calc item names. I’m not checking that these names exist not to complicate things further, but you could do it if you wanted to — calc item names are values in a column after all. Here what is nice is that I don’t explicitly use either YTD or PYTD so I can just duplicate the calc item and with the name of the calc item define which two calc items should be used for comparison.
Now that we have options, we might as well bring the calc items into a slicer on the report canvas and give the user control on what should be displayed
I know, it looks like it does not really work because the big number does not change when I change the KPI comparison Calc Item, but it’s OK — the reason is that I only filter by year so the latest value (which is what is displayed) is adding exactly the same rows for both YTD and MAT, exactly from Jan 1st to December 31st.
Anyway, this is how you can do it. You might want to twist it a bit more and for goal use a measure that adds the value for daily forecast — you would change the dynamic measure calc group and break it into different branches for dummy, return Actual value for dummy 2 return forecast value and the rest is the same. Building a cool & dynamic KPI card is now up to you!
Thank you for reading and keep playing with Calc Groups!
Here you can download the pbix file
Follow the conversation on LinkedIn and Twitter post announcements