Comparing snapshots by state

Hello hello, I’m not writing that much lately due to spring break and a DAX training I’m teaching, but I think I have just enough time to explain a fun use case I found the other day at work. In Real Estate each asset can be in a bunch of different states, especially if there is litigation, squatters, repairs etc. So in this case they want to compare the latest snapshot with the snapshot of one week ago, and see how many assets they have in each state, but also in which state were they a week ago. Let’s get to it!
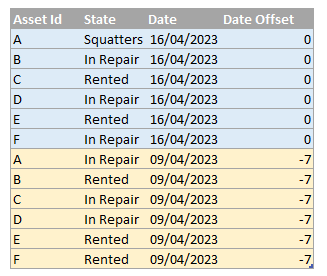
Let’s start with some simple data. For simplicity is best to work with a closed list of assets you are managing. That way we don’t have to take care of new assets or asset’s that are no longer there. If there’s time and energy we might see them later on this article. So let’s consider a snapshot fact table that looks like this
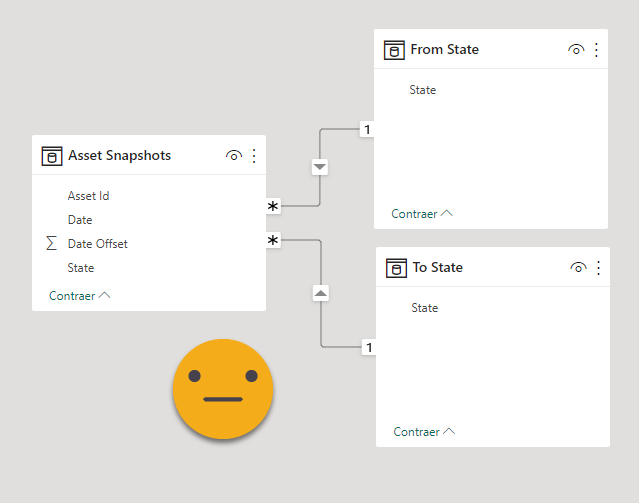
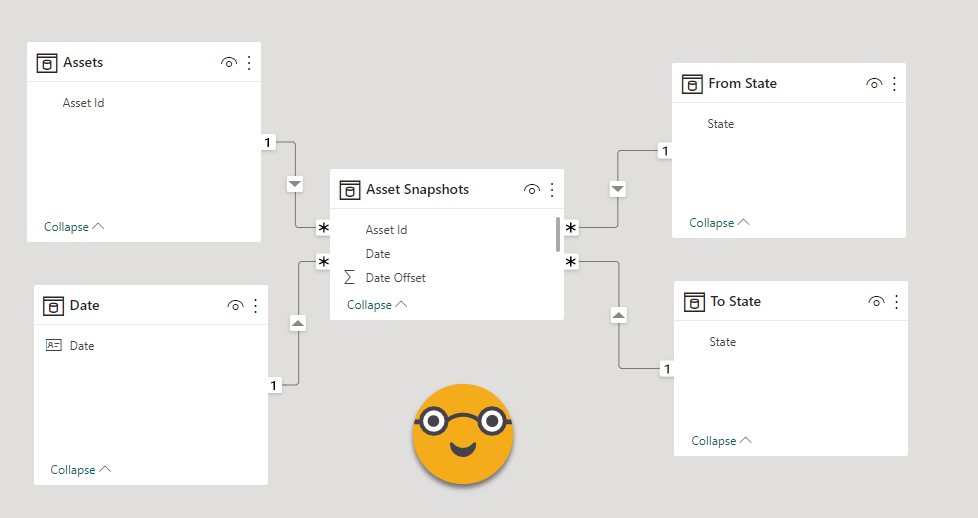
Basically we want to build a matrix where rows are the «From» state and the columns are the «To» state. After giving it some thought I decided that the way to go was creating two dimensions a «From State» and a «To State» dimensions. the contents of both are the same, the list of possible states. This will allow us to keep one of the filters while removing the other. To build the dimension We’ll try some quick DAX and if needed we’ll upgrade to some Power Query. For now we can define two tables
---------------------------------
-- Calculated Table: 'From State'
---------------------------------
TABLE 'From State' = DISTINCT('Asset Snapshots'[State])

-------------------------------
-- Calculated Table: 'To State'
-------------------------------
TABLE 'To State' = DISTINCT('Asset Snapshots'[State])
Can create a relationship between each of them and the «State» column of the fact table
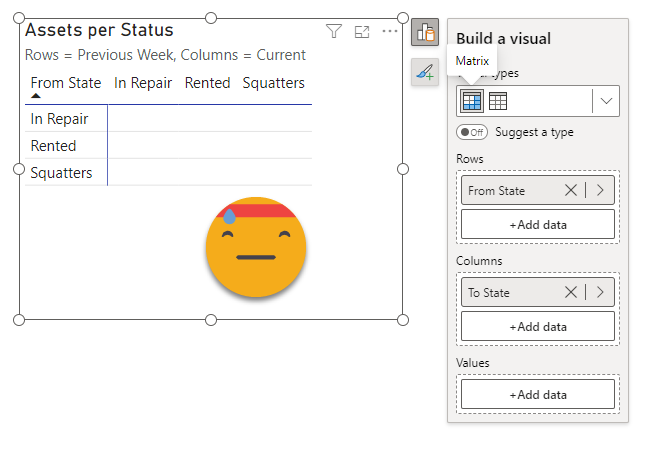
Now we can set up a matrix visual, and start thinking about the measure.
Basically we need to capture the list of Id’s that belong to the whole row using last week’s data, then the list of Ids that belong to the whole column using current data and intersect them. That’s what we are after. Let’s DAX it!
Assets From To State =
VAR idsLastWeek =
    CALCULATETABLE (
        VALUES ( 'Asset Snapshots'[Asset Id] ),
        'Asset Snapshots'[Date Offset] = -7,
        REMOVEFILTERS ( 'To State' )
    )
VAR idsCurrentWeek =
    CALCULATETABLE (
        VALUES ( 'Asset Snapshots'[Asset Id] ),
        'Asset Snapshots'[Date Offset] = 0,
        REMOVEFILTERS ( 'From State' )
    )
VAR idsBoth =
    INTERSECT ( idsLastWeek, idsCurrentWeek )
VAR idsCount =
    COUNTROWS ( idsBoth )
RETURN
    idsCount
Here is important that the REMOVE filters is acting on the whole ‘From State’ and ‘To State’ tables. The reason is that if later you want to sort estates in an order that makes sense from a business perspective, you would get incorrect results, as only values from the same «from» and «to» state would be shown. The reason is that the sort by column would be implicitly still be filtering the data even after you removed the main column from the filter context. The morale of the story is: unless you really want to keep some column filtering of the table, just go for REMOVEFILTERS on the entire table.
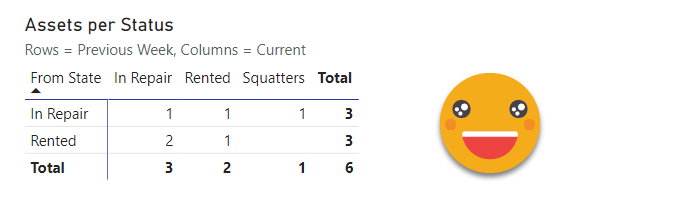
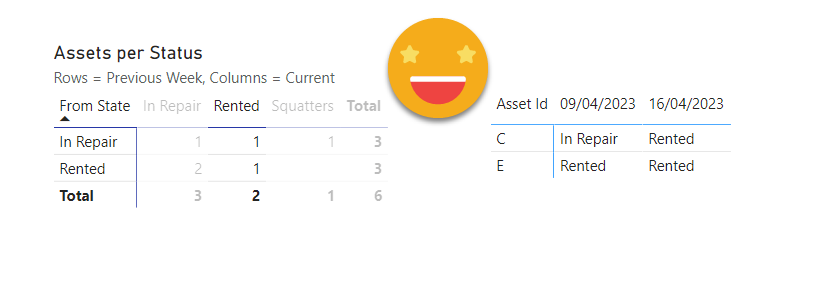
But does it work?
Yes it does!!
From this point on go the extra mile and show the Ids of each cell, through a tooltip or just a regular table next to the matrix.
In this matrix is important that only the Id and the measure are added, if you add more columns from the fact table you'll see that you get a blank table. Luckily I've fought this fight before in this article.
Whenever you want to expand the filter context while doing a cross-filter (or drill through, or tooltip) you need to work with dimensions that are not in place in the original visual. In this case I created an «Asset» dimension and a «Date» dimension (I had none yet — this IRL will be most likely a «Date Crossfilter» or «Date tooltip»).
-----------------------------
-- Calculated Table: 'Assets'
-----------------------------
TABLE 'Assets' = DISTINCT('Asset Snapshots'[Asset Id])

---------------------------
-- Calculated Table: 'Date'
---------------------------
TABLE 'Date' = CALENDAR(dt"2023-01-01",dt"2023-12-31")
And now the tricky part. Basically we’ll check if the assetId is one of the selected ones on the main visual, then we’ll get the date of the row, and then we’ll go pick up an attribute from the fact table for that Asset Id and date. For this example I’m using the estate, but it could be any other column (think comments for instance) and of course you can create as many such measures as you want. The DAX looks like this:
Assets Full Hist =
VAR assetIds =
    CALCULATETABLE (
        VAR tmp =
            ADDCOLUMNS (
                Assets,
                "@relevant", [Assets From To State]
            )
        VAR relevantRows =
            FILTER (
                tmp,
                [@relevant] <> BLANK ()
            )
        VAR onlyIds =
            SELECTCOLUMNS (
                relevantRows,
                "Asset Id", Assets[Asset Id]
            )
        RETURN
            onlyIds,
        REMOVEFILTERS ( 'Date' )
    )
VAR assetId =
    SELECTEDVALUE ( Assets[Asset Id] )
VAR result =
    IF (
        assetId IN assetIds,
        VAR dt = SELECTEDVALUE ( 'Date'[Date] )
        VAR assetStatus =
            LOOKUPVALUE (
                'Asset Snapshots'[State],
                'Asset Snapshots'[Asset Id], assetId,
                'Asset Snapshots'[Date], dt
            )
        RETURN
            assetStatus,
        BLANK ()
    )
RETURN
    result
If you just pick one attribute you can show it as a matrix with the two dates as columns and might become a bit easier to read for the user.
And that’s it! As you can see there’s a lot you can do with a bunch of snapshots as long as you have some id to track what happened to each. If you are into snapshots, check out my other articles on reporting on snapshot changes.
Thank you for reading!
if you want to play with the pbix, knock yourself out! Here’s the file
As usual, follow the conversation on Twitter and LinkedIn