Category: Power BI

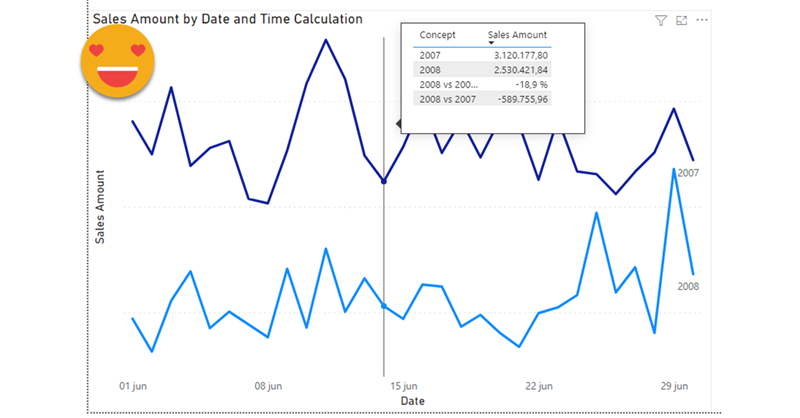
In this post I’ll explain how to break the tyranny of the «all filters» that are passed to the tooltip in particular the filters set by a calculation group which are even nastier to get rid of than regular filters.

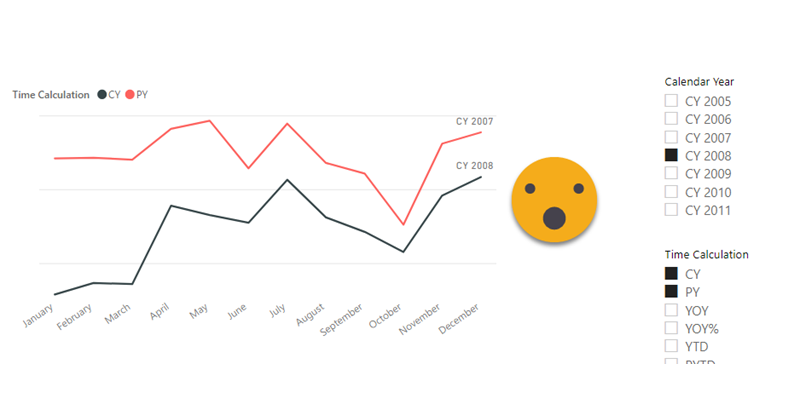
It wasn’t intended this way, but this post is sort of a sequel (and not SQL) of my post on dynamic labels for time calculation series, which itself builds on the post introducing the time intelligence calculation group script. If you have not read them you can also watch the video you’ll find on the end of each post — although from the sound quality maybe it’s less painful to read the blog!

Anyway, if you are here probably you know something about calculation groups, and that’s good, because there’s plenty of them coming.

Continue Reading..

I’ve seen it many times. While there is a set of «official» attributes for a product, or a client or whatever, a department may choose to group them through one or more custom attributes. And what do they do? Of course, they create an excel file where they manually maintain a table with the key (hopefully) and all the custom columns. They will tell you that they update it whenever a new value appears in the datasource, but if you double check this statement you might get let’s say «mixed results» at best.

Nothing says «there is a problem» as a red button appearing in your report. And if it offers «actionable insight» on how to solve the problem, so much better. So this is what we’re going to do: A data problem button.

Continue Reading..

As I continue my journey with calculation groups I realize that fewer and fewer people may be interested in what I write, but then I think, «so what?» So here I am.

My script to create a Time Intelligence Calculation Group based on Daxpatterns.com definitions got a lot of attention (for my standards, anyway), so I kept on thinking if there’s anything that would go nice with it.

Indeed, in the latest iteration of the script, there are two measures that aim at providing some sort of dynamic labeling. «Label as Value Measure» is a measure that when in the scope of a Time Calculation of the calculation group, will show the appropriate label taking into account the filters on the date table. For instance, if you select YTD calculation item and year 2008, the measure will show «2008 YTD». And so on. (Label as Format String does the same but using the format string expression so it can be used as sort of dynamic axis labels if you want to place several calculations as the X-axis, but we’ll focus on «Label as Value Measure» which has more general applications)

Continue Reading..

Sometimes we face models which can’t be built because we fall into the circular relationship (which Power BI protects us against) or ambiguity (which sits there silently making all our results meaningless). I faced one of this situations the other day at work and found a workaround with –you guessed it– a calculation group.

Continue Reading..

This is one problem that you don’t realize it’s a problem until you face it.

Happened to me designing a P&L report. For this report, an arbitrary list of items (arbitrary to me of course) has to be displayed in certain order, each with it’s own arbitrary calculation, and even with some hierarchy indentation. Easier said than done, really.

Continue Reading..

This post is based in a true use case. The customer followed the market share trends, to see how it compared to the rest, as a manufacturer, and at a brand level.

So far so good. But coming from excel they were used to build charts any way they saw fit, so they liked to see on the same chart their own year-on-year growth in general as a manufacturer, then in different distribution channels, then specifically the growth of their two main brands, and then the growth on different regions. That alone was my first challenge. But then they said that that they would like to know how others were doing on the tooltip. But of course, when looking at a manufacturer-level value, they would like to see their value together with that for other manufacturers, and when looking at a brand level then wanted to see it with all  the other brands. I added to the mix that it would be nice to see highlighted their own value in the tooltip of course.

Continue Reading..

Ok, by now you probably know I’m a liiiiitle too much into calculation groups. Once you try calculation groups there’s no going back. Particularly if you do time intelligence analysis (that is comparing values with the previous year, but many other things as well). The reason is that normally you would create a new measure for each pair of calculation – measure, (e.g. Sales Amout PY, Sales Amount YTD,  Total Cost PY, Total Cost YTD … ). With calculation groups you just create the box that shifts a measure into producing the time calculation that you want.

Continue Reading..

Ok, this is a rather niche use case, but I’ll go ahead anyway, basically because I think it’s cool.

In conditional formatting in Power BI you have three options: By values, by rules and by measure.  In this last case, you have to provide a measure which provides a hexadecimal code, such as #FFFFFF for white and so on. When I saw this option I liked it because you can write the most twisted logic of the world and format according to that, but I felt uneasy about the fact that you have to hardcode the hexadecimal codes in the DAX logic. WHAT IF YOU DECIDE TO CHANGE THE THEME OF YOUR REPORT??

Continue Reading..

Calculated tables are not used often, because after all, it only combines data that you already have, right? Well, I didn’t use them often, until recently.

I was shown an excel chart displaying market share among top contenders, but including CY vs PY, then CYTD vs PYTD, then MAT vs MAT-1, and then the last 12 months as individual points. «This is what we would like to have»
Continue Reading..


Contacto

Contacta con nosotros y descubre el poder de la información.

Nombre
Email
Consulta

Ok! Mensaje enviado.
Error! Verifica los campos.
© Copyright 2022 - Esbrina