YES! Public preview is finally here, and DAX UDFs have the potential to change how we write DAX in a big way. If you don’t know what UDFs are, head over to Microsoft (and SQLBI of course) and learn everything they have said about them first, no point in repeating it here. If you want to go deeper, come along!
Continue Reading..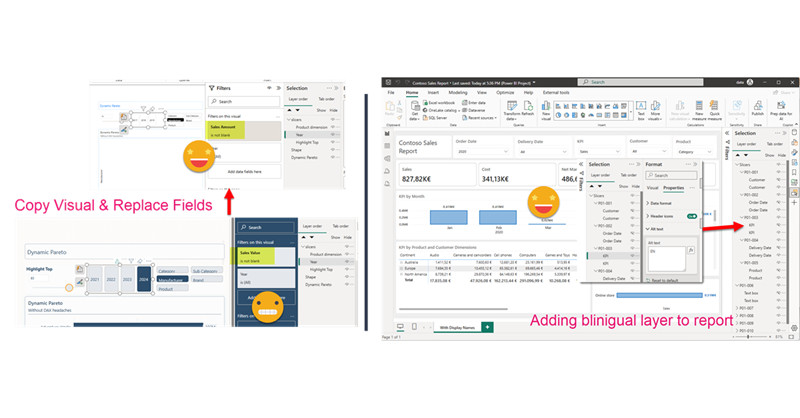
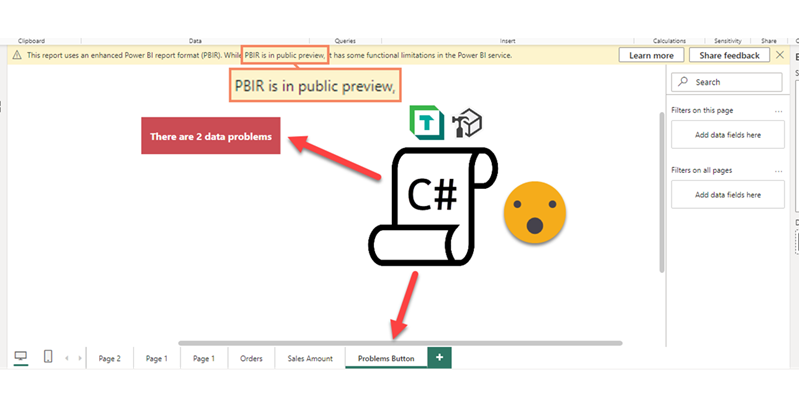
Hello again. Today I’ll introduce two new Tabular Editor C# Scripts that might help you at some point if you are already using the PBIR format (which is in preview, so don’t rush it!). The first one is to copy a visual, which at first does not look impressive, but remember that swapping fields in Power BI desktop breaks many more things that you would expect. Next we’ll see a script I built for myself if I ever have to make another report bilingual. The initial report preparation phase is now automated. That’s only part of the work, but still it’s an nice improvement.
Continue Reading..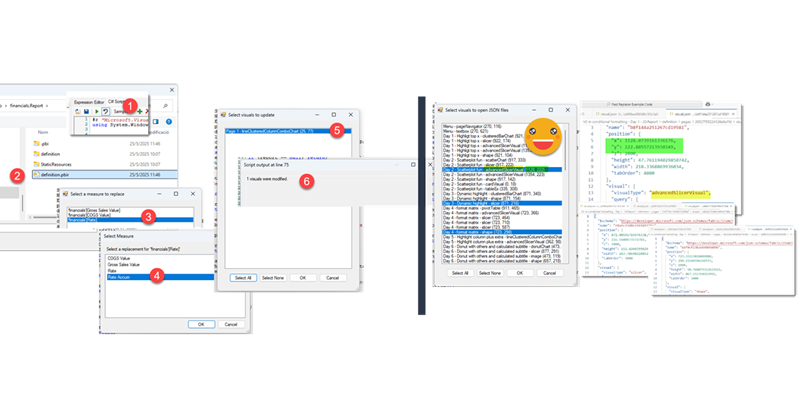
In comparison with my previous post, this one was an absolute breeze to write. Just an idea, some little tweaking with ChatGPT and GitHub CoPilot. Both come from the daily little miseries of daily with Power BI. One is replacing fields in a visual, the other one is finding the visual.json file of certain visual to see how to tackle that bit of configuration you want to change. Let’s get to it.
Continue Reading..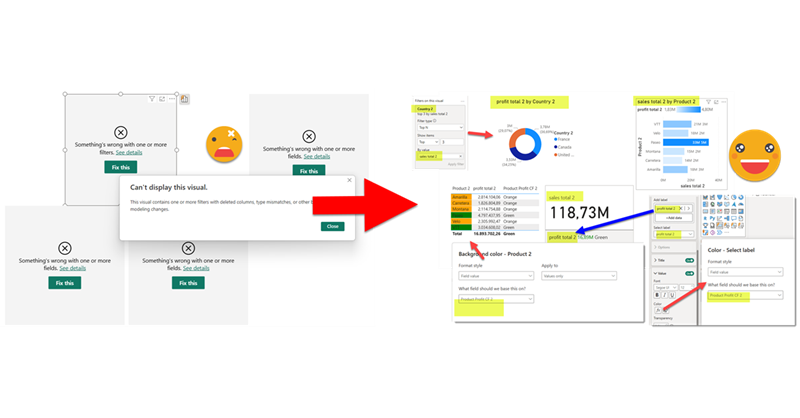
This is quite crazy. I was trying to write a quick blog post to get back in swing over here, so I thought of a stream lineddd approach set maximum and minimum values for axis to properly show data labels, with a calc group and so on. Then it was impossible for me to sshow an example of the problem I was trying to solve. But then worse. I realized that you can now use visual calculations for those! So my approach was dobsolete before I presented it to the world. Of course I wanted to do something, and as usual I’m very much about automating stuff. Would it be possible to automate the creation of visual calculations?? Well, for that I would need to really parse the visual.json files of the new pbir reports. I have played around modifying the report layer before, but this time I had to do it for real. Instead of creating new stuff, I wanted to look at was already created! Time to tackle all those little jsons.
In this post I’ll explain how I authored a script that detects broken references in PBIR reports, asks the user for replacements, and then fixes the report. However, this is just the excuse, the way I wrote it opens the door to pretty much any script you can think of to modify the report layer. Let’s get started!
Continue Reading..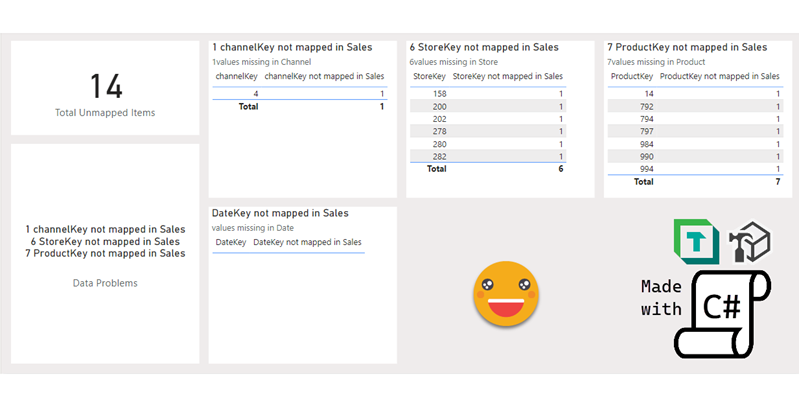
Hello again!
I’m back with the other use case I have in mind for Report-layer scripts. If you haven’t read yet my previous blog post I recommend you do this now as we’ll be building on that with a more complex use case. When I first managed to develop C# in visual studio I rushed to write something I could not build by adapting code snippets only. I made a script that iterated the model relationships and built measures to detect invalid relationships. Not only that, if you build the proper table with the column of the «many» side of the relationship with the measure, you can identify who are the offending values and take action. The script is cool as it is, but again, building each of the tables is quite a pain. Let’s see if we can automate this one. This time I’ll be writing as I author the script. Let’s see how it goes.
Hello!
Today’s post is quite special for me as I wished that this day would come. When I wrote the article to generate the measures for a dynamic data problems button there was a section that read «So, let’s build this button then. This part, unfortunately cannot be scripted, so we’ll need to work a little bit.». Well, maybe this is a thing of the past. Let’s see how can we script this part too. Before going diving in though I want to thank Xavi Paterna for helping me out with his tremendous knowledge of C# programming.
Hello! Today we leave PowerApps aside, but we head into yet another area way out of my confort zone: Programmatic creation and refresh of custom M Partitions! this is not something I really wanted to do, but I found myself with no other option available. Are you ready? Let’s do it. Continue Reading..
Hello!
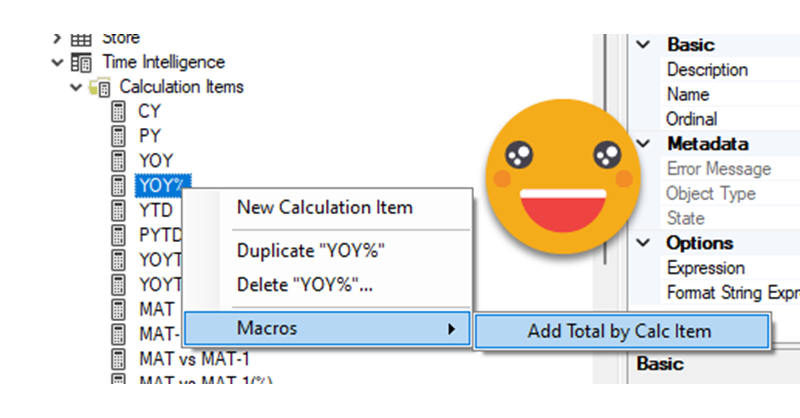
Today (well yesterday by the time I have finished writing this) saw a great use case of calculation groups and I wished I had come up with the idea myself because it’s awesome and something that I’ve come across sometimes. In a table there’s a breakdown by month, and at the total they want to see sum, but also want to add another column with say the average, but could be also the value last year or growth. Yes, I’m talking about the latest video from Chandeep Chabbra. The video is beautifully set up so it’s definitively worth a watch.
Even though there’s a few things I would change from the DAX of the format string expressions, that alone would not justify a blog post about the same use case. But yet I wanted to play with the calc group, so what I plan to do instead is to show you the process to «industrialize» this calculation group, i.e. how to create a script that will replicate similar logic whenever you want to use it. Yes, I mean a c# script. That’s something I’ve been doing lately in some sessions, but it’s not yet in the blog so why not use this occasion for it.
Well, I was happy with the result, but I was even more happy with the reaction on twitter. The dynamic header effect felt like magical to many people, and well, I have many more followers now, thank you all.
In case you haven’t seen it, here’s the video
So how did I do it? Short answer: Field parameters. A little longer answer: Measures and a calculation group create more measures that are put in field parameter with some customization.
Even longer answer? Let’s do it.
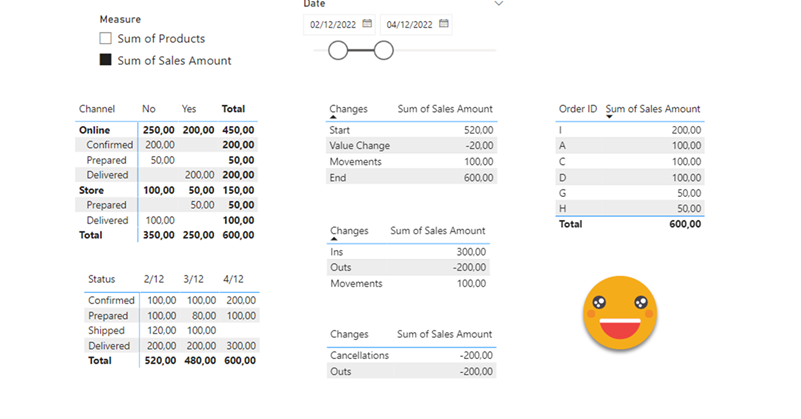
Hello again. You didn’t think there would be a second part, right? well, me neither. But as things turn out, I had to work on another report dealing with snapshots, and this time they wanted something fancier. It took me a while to figure it out, but I like the result so I thought it would be nice to share. In the first part, we just showed what went up and what went down, being able to go back and check any snapshot. However, in many use cases that does not tell the whole story. To explain why something went up or down, you need to show what went in, what went out (sometimes important to tell which way it went) and maybe even if the value changed between snapshots. If we just compare 2 consecutive snapshots is not that hard, but things get trickier we take longer time spans and we want to account for everything that happened in between.