Hello!
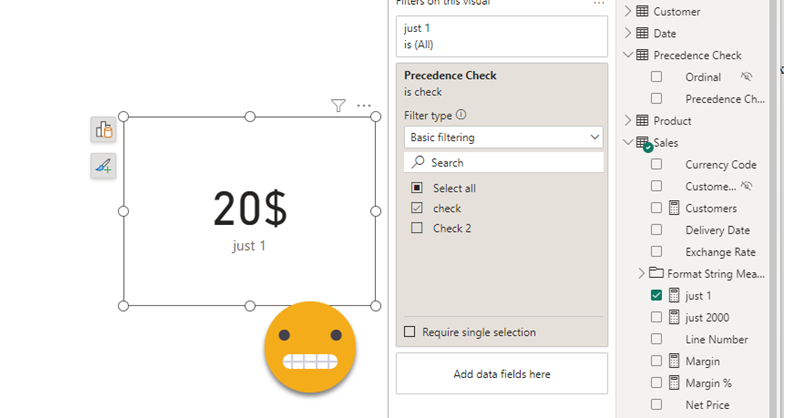
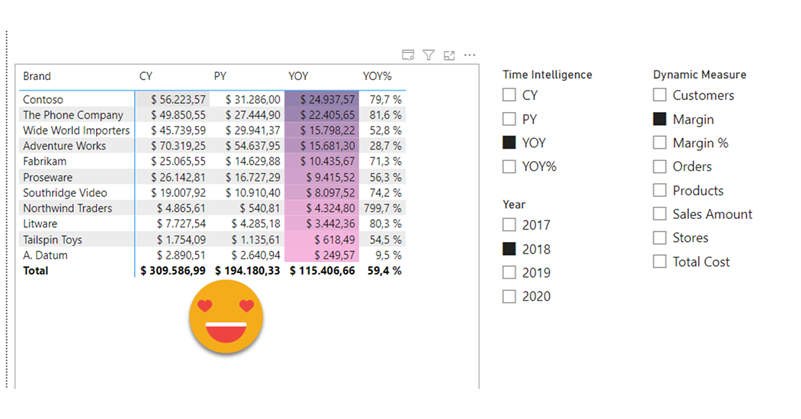
Today (well yesterday by the time I have finished writing this) saw a great use case of calculation groups and I wished I had come up with the idea myself because it’s awesome and something that I’ve come across sometimes. In a table there’s a breakdown by month, and at the total they want to see sum, but also want to add another column with say the average, but could be also the value last year or growth. Yes, I’m talking about the latest video from Chandeep Chabbra. The video is beautifully set up so it’s definitively worth a watch.
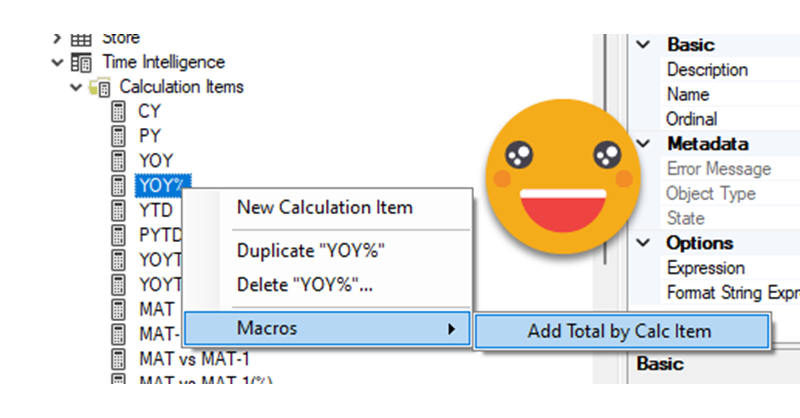
Even though there’s a few things I would change from the DAX of the format string expressions, that alone would not justify a blog post about the same use case. But yet I wanted to play with the calc group, so what I plan to do instead is to show you the process to «industrialize» this calculation group, i.e. how to create a script that will replicate similar logic whenever you want to use it. Yes, I mean a c# script. That’s something I’ve been doing lately in some sessions, but it’s not yet in the blog so why not use this occasion for it.
Continue Reading..