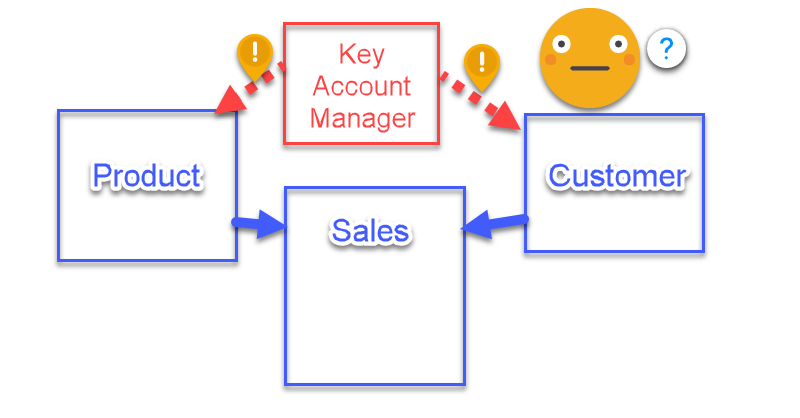
Sometimes we face models which can’t be built because we fall into the circular relationship (which Power BI protects us against) or ambiguity (which sits there silently making all our results meaningless). I faced one of this situations the other day at work and found a workaround with –you guessed it– a calculation group.
This is one problem that you don’t realize it’s a problem until you face it.
Happened to me designing a P&L report. For this report, an arbitrary list of items (arbitrary to me of course) has to be displayed in certain order, each with it’s own arbitrary calculation, and even with some hierarchy indentation. Easier said than done, really.

This post is based in a true use case. The customer followed the market share trends, to see how it compared to the rest, as a manufacturer, and at a brand level.
So far so good. But coming from excel they were used to build charts any way they saw fit, so they liked to see on the same chart their own year-on-year growth in general as a manufacturer, then in different distribution channels, then specifically the growth of their two main brands, and then the growth on different regions. That alone was my first challenge. But then they said that that they would like to know how others were doing on the tooltip. But of course, when looking at a manufacturer-level value, they would like to see their value together with that for other manufacturers, and when looking at a brand level then wanted to see it with all the other brands. I added to the mix that it would be nice to see highlighted their own value in the tooltip of course.
Ok, by now you probably know I’m a liiiiitle too much into calculation groups. Once you try calculation groups there’s no going back. Particularly if you do time intelligence analysis (that is comparing values with the previous year, but many other things as well). The reason is that normally you would create a new measure for each pair of calculation – measure, (e.g. Sales Amout PY, Sales Amount YTD, Total Cost PY, Total Cost YTD … ). With calculation groups you just create the box that shifts a measure into producing the time calculation that you want.
Ok, this is a rather niche use case, but I’ll go ahead anyway, basically because I think it’s cool.
In conditional formatting in Power BI you have three options: By values, by rules and by measure. In this last case, you have to provide a measure which provides a hexadecimal code, such as #FFFFFF for white and so on. When I saw this option I liked it because you can write the most twisted logic of the world and format according to that, but I felt uneasy about the fact that you have to hardcode the hexadecimal codes in the DAX logic. WHAT IF YOU DECIDE TO CHANGE THE THEME OF YOUR REPORT??

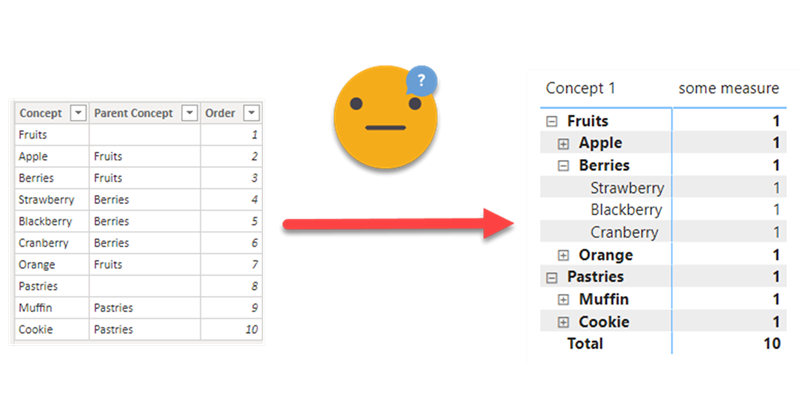
Calculated tables are not used often, because after all, it only combines data that you already have, right? Well, I didn’t use them often, until recently.
I was shown an excel chart displaying market share among top contenders, but including CY vs PY, then CYTD vs PYTD, then MAT vs MAT-1, and then the last 12 months as individual points. «This is what we would like to have»
Continue Reading..