Once again I’ll recreate here a use case I found at work because I think it’s cool and with some gotcha’s that can be fixed.
The use case itself is broad enough. We are measuring the duration of an event (working hours, machine runs, etc) and we want to visualize it. Since we want to compare things, we need to graph a number, however, as humans, we might like to see 4h 30min instead of 270 min. Searching around in google you will find several approaches for transforming a number of minutes or seconds into higher units of time. And that’s a great starting point. For example here’s a great post by Reza Rad. Here we’ll just imagine we have minutes and we want hours and minutes.
Let’s say we have an ‘Operations’ table that looks like this
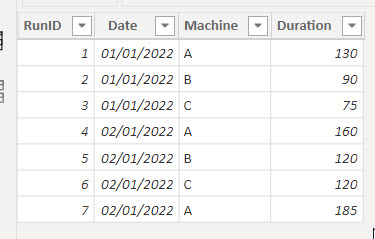
From there we can define a simple measure like
Duration in Minutes = SUM(Operations[Duration])
And then we can define a new measure using the code from Reza (do visit his site as he has quite a few more use cases and alternative solutions in the comments)
String Duration in Hours and Minutes =
VAR vMinues = [Duration in Minutes]
VAR vHours =
    INT ( vMinues / 60 )
VAR vRemainingMinutes =
    MOD ( vMinues, 60 )
RETURN
    vHours & " Hours & " & vRemainingMinutes & " Minutes"
This measure indeed looks beautiful on a table
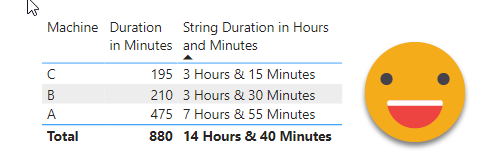
So far so good, but as the name of the measure tells us, this is just a string. Not good for charts.
So we need to use the regular duration for the chart, but then we lose the hours and minutes format! AAAAAAARG! I wish there was a way do dynamically define format strings taking into account measures evaluated in the filter context of each data point… Wait a minute! YES! Calculation groups to the rescue! 🎉
Fire up Tabular Editor and let’s get to it — Use whatever tabular editor flavor you have at hand. We create a «Format» calculation group, and rename de column to «Format» as well. Then we create a calculation item called «Hours and Minutes» And we paste the whole thing in the format expression! For value we do not want to change it, so we just keep SELECTEDMEASURE(). While you are at it you might want to build for the future and make it work with any Minutes measure you may have. So at this point it should look like this (spoiler: this will fail, but is what I did and I want you go feel the aha feeling too with the solution)
CALCULATIONGROUP 'Format'[Format]

    CALCULATIONITEM "Hours and Minutes" = SELECTEDMEASURE()
        FormatString =
            IF(
                ISSELECTEDMEASURE( [Duration in Minutes] ),
                VAR vMinues = SELECTEDMEASURE()
                VAR vHours = INT( vMinues / 60 )
                VAR vRemainingMinutes = MOD( vMinues, 60 )
                RETURN
                    vHours & " Hours & " & vRemainingMinutes & " Minutes",
                SELECTEDMEASUREFORMATSTRING()
            )
Note: this is the DAX Script of the calculation group. In tabular Editor 3 you can just paste it in a DAX script tab and execute (adapting it to the measure names in your model of course). In Tabular Editor 2 you need to use the expression after the calculation item name (the part written in blue for clarity) in the value expression and the expression shown after «FormatString=» (the part written in orange) in the Format String expression pannel.
2022-01-12 update: I changed variable vMinues to get the value of SELECTEDMEASURE() in case other measures are added as arguments of ISSELECTEDMEASURE( … ) in the previous row.
Nothing wrong with it, huh?
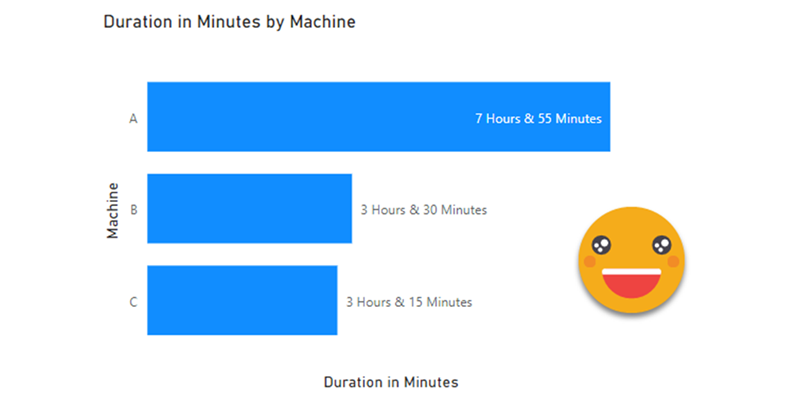
Let’s see if it works. We build a bar chart, use the [Duration in Minutes] In the values field, machine for axis and then we drag our calculation group column to the visual level filters, and activate the «Hours and Minutes» calculation item. Here’s what comes out
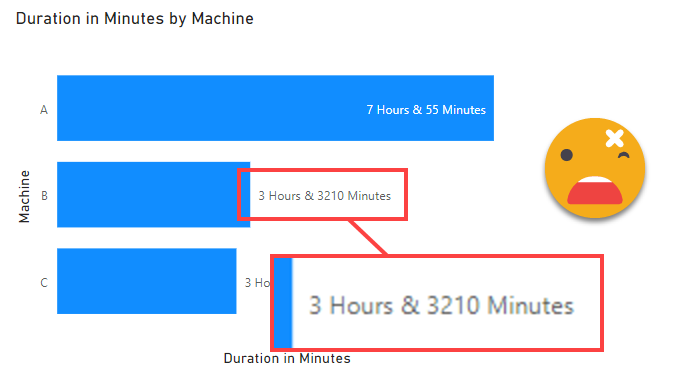
So the first one looks fine, but the second one is totally wrong. How’s that even possible?!? It took me quite a few tries, until I remembered that Format Strings are a world in itself, and we need to tread carefully. It’s important to remember that the main use of format strings is not to write arbitrary things in data labels, but rather get the number that comes and give it some nice formatting, like 0.1 convert it to 10% say by using format string «0%». If we just write some text there, sometimes it may work, sometimes we’ll have a trainwreck like for Machine B in the chart. What is to be done then?? The ironic thing is that I had fought this fight before, but I just did not remember it at first… if we just want to put some text in the data label, it must be «protected» by double quotes inside the string. But to define a string we are already using double quotes! How can we say, wait this is a double quote that should stay, and this one is the double quote finishing the string? The answer to this is, yes, double double quotes. I’m not kidding.
In our case we just want to add a double quote in the beginning and one at the end. So to concatenate anything before we’ll need to enclose it in double quotes right? And then this thing we want to concatenate is » right? but inside the string we need to use double double quotes, so the final result is:
CALCULATIONGROUP 'Format'[Format]

    CALCULATIONITEM "Hours and Minutes" = SELECTEDMEASURE()
        FormatString =
            IF(
                ISSELECTEDMEASURE( [Duration in Minutes] ),
                VAR vMinues = [Duration in Minutes]
                VAR vHours = INT( vMinues / 60 )
                VAR vRemainingMinutes = MOD( vMinues, 60 )
                RETURN
                    """" & vHours & " Hours & " & vRemainingMinutes & " Minutes" & """",
                SELECTEDMEASUREFORMATSTRING( )
            )
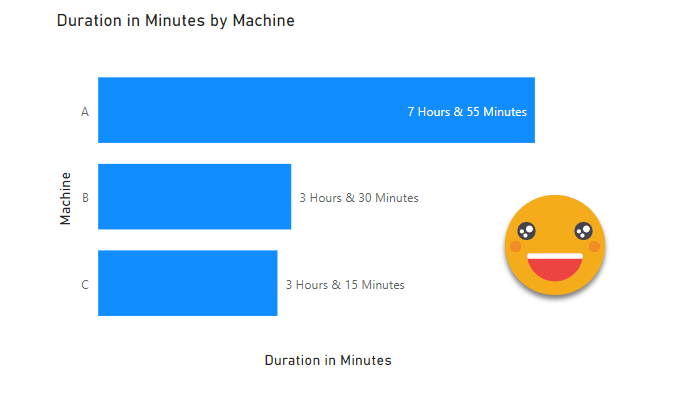
And, now, does this work? You bet it does!
And that’s it! I hope you liked it
if you want to play around it here’s the PBIX