Hello!
The other day on the PUG Barcelona whatsapp group there was a question regarding the possibility of reversing the selection on a slicer, with a single click. Apparently this is something you can do on Qlik and the fellow member was trying to migrate that to Power BI as the users are used to be able to do it. I thought that you can get somewhat close to that with a calculation group, so why not write a nice short article on it. Let’s do it!
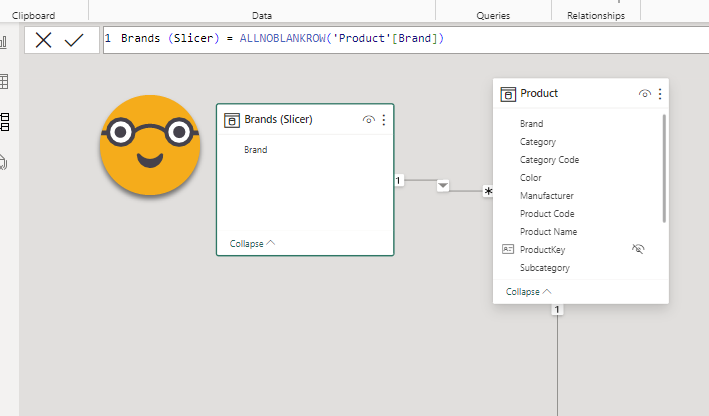
If we think about the problem for a while, we’ll see that in order to reverse the filtering that is defined in a slicer, we’ll need a small table just for that slicer. Let me explain. If you are filtering by Product brand, and you may have some visuals slice data by brand as well you are in trouble. Once you set a filter on that table, you can’t take that filter away. As I’ve said in the past, «when a table is filtered, is filtered!» All you can do is to remove or modify the effect that this table has in other tables. At least is a way to keep things simple and straight forward. So instead of filtering the brand field of the products table, we’ll create a small table with just the brand names and connect that with the brand field of the product table.
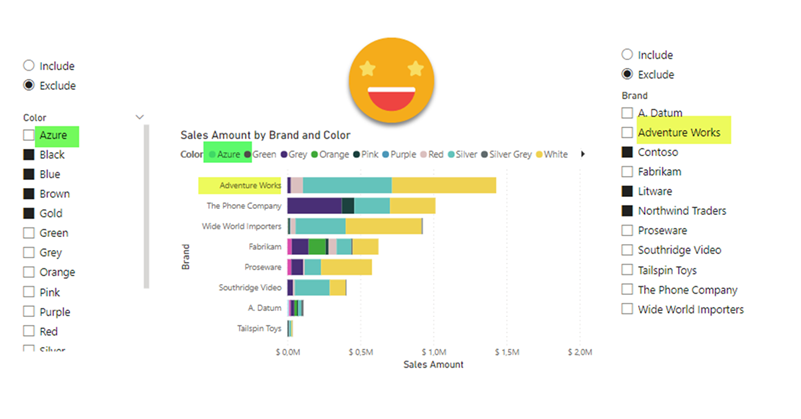
With this problem out of the way, building a calculation group that will reverse the items selected is quite straight forward. One calculation item will filter by the selected brands, which we can call «Include». Then we can have another calculation item that will filter to all the other items. Since we cannot (yet) change the selection on a slicer, we can say that the selected items are the excluded items. This is why I added a «(sort of)» in the title. We’ll get the reverse filtering without actually reversing the items selected in the slicers. So how does the calc group show? I’ll paste here the TE3 syntax as usual:
-------------------------------------
-- Calculation Group: 'Reverse Brand'
-------------------------------------
CALCULATIONGROUP 'Reverse Brand'[Reverse Brand]

    CALCULATIONITEM "Include" =
        SELECTEDMEASURE ()
        Ordinal = 0

    CALCULATIONITEM "Exclude" =
        VAR includedValues =
            VALUES ( 'Brands (Slicer)'[Brand] )
        VAR excludedValues =
            EXCEPT (
                ALL ( 'Brands (Slicer)'[Brand] ),
                includedValues
            )
        VAR result =
            CALCULATE (
                SELECTEDMEASURE (),
                REMOVEFILTERS ( 'Brands (Slicer)' ),
                excludedValues
            )
        RETURN
            result
        Ordinal = 1
As you see for the «excluded» calc Item we get all first the selected values, then we use that to detect the non selected values. Finally we remove all filters coming from the table to establish the filter on the non selected values.
Before I get carried away on further details, let’s first check if this works:
As you can also see, the DAX relies on the exact column that is being used for the slicer, so if you want to do this trick with several fields, you will need different tables and calculation items. But now that I think of it, you will even need different calculation groups! you may think that’s overkill, that you can just have different calc items on the same calc group. But that would break one of the sacred laws of calc groups… you can’t have more than one calc item from the same calculation group filtering the same data point. But it might we worth checking in detail.
I repeated the whole process for color. Then I created a calculated column on my calc group to group the calculation items. Yes you can do that actually. Actually you can even create a column to have nicer names for your calc items, and even have repeated names! I didn’t know this one, Owen Auger described how in this awesome blog post. Basically with Tabular Editor you need to choose the Group By columns of this Alias column to be the calculation group column and that’s it! you can even sort it the same way if you want with the ordinal column. So Then I used the group calculated column and the alias calculated column to create a slicer. But alas! when I try to select Exclude in both concepts, no item is applied so i rather get an «include» behavior in both slicers…
Of course we can go around this problem by creating separated calculation groups for each slicer. Not great, but if it’s just two maybe it’s ok. If they ask it for all 20 slicers of you report, then I have a question for you: what are you doing with 20 slicers? And an answer to whoever is requesting this: «This is not possible on Power BI, at least with the native slicer». Maybe there’s some custom visual that does this trick. Too bad that there’s no Deneb-like visual for slicers where you can define custom buttons and actions. Anyway, for two slicers it can be done and it works! If your model is huge and your measures complex, your mileage may vary, but it does not seem to be too bad. But then again this is a small model, with just two calc groups.
And that’s about it! It looks like it can be automated to a large degree. Might be tricky adding the calc columns to the calc group without syncing once, I’m not sure. But anyway, if I just said that you should not overdo it maybe automating it is not the best way forward. Anyway, if I get the chance to present again the integration of Visual Studio with C# Scripting I might pick this use case and see where it goes. As for now it was a nice exercise and maybe it will expand how you think about DAX and Calc Groups.
Thank you for reading and follow this conversation on Twitter and LinkedIn.
Regards!