Two new C# Scripts for PBIR: Replace Fields & Open Visual Json files

In comparison with my previous post, this one was an absolute breeze to write. Just an idea, some little tweaking with ChatGPT and GitHub CoPilot. Both come from the daily little miseries of daily with Power BI. One is replacing fields in a visual, the other one is finding the visual.json file of certain visual to see how to tackle that bit of configuration you want to change. Let’s get to it.
Replacing fields
This week I experienced what happens when you replace a field in a visual. If you have the «On-Object Interaction» enabled (still in preview… not clear when it will go GA), for each field you get a right pointing arrow inviting you to replace it by something else.
This sounds very convenient. You go about your day and you have your chart fully configured with the right colors and right data labels and everything (sometimes you need to configure some stuff manually, even when you have a wonderful theme file as Kurt Buhler encourages you to do). As you can see we are using a display name for the «Rate» measure of the line. This will be important later on.
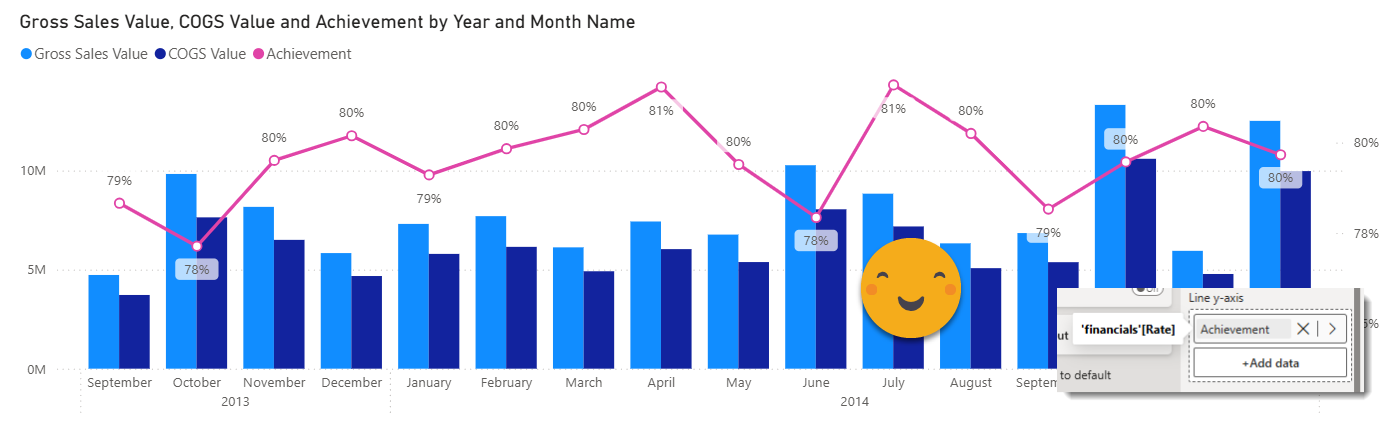
You show it to your boss and she says, «Can you make the line stay above the columns? I don’t like the overlap». Luckily you are aware of all the new features of Power BI and you know that you can have now Visual Calculations to define max and min values of axis. Let’s do it!
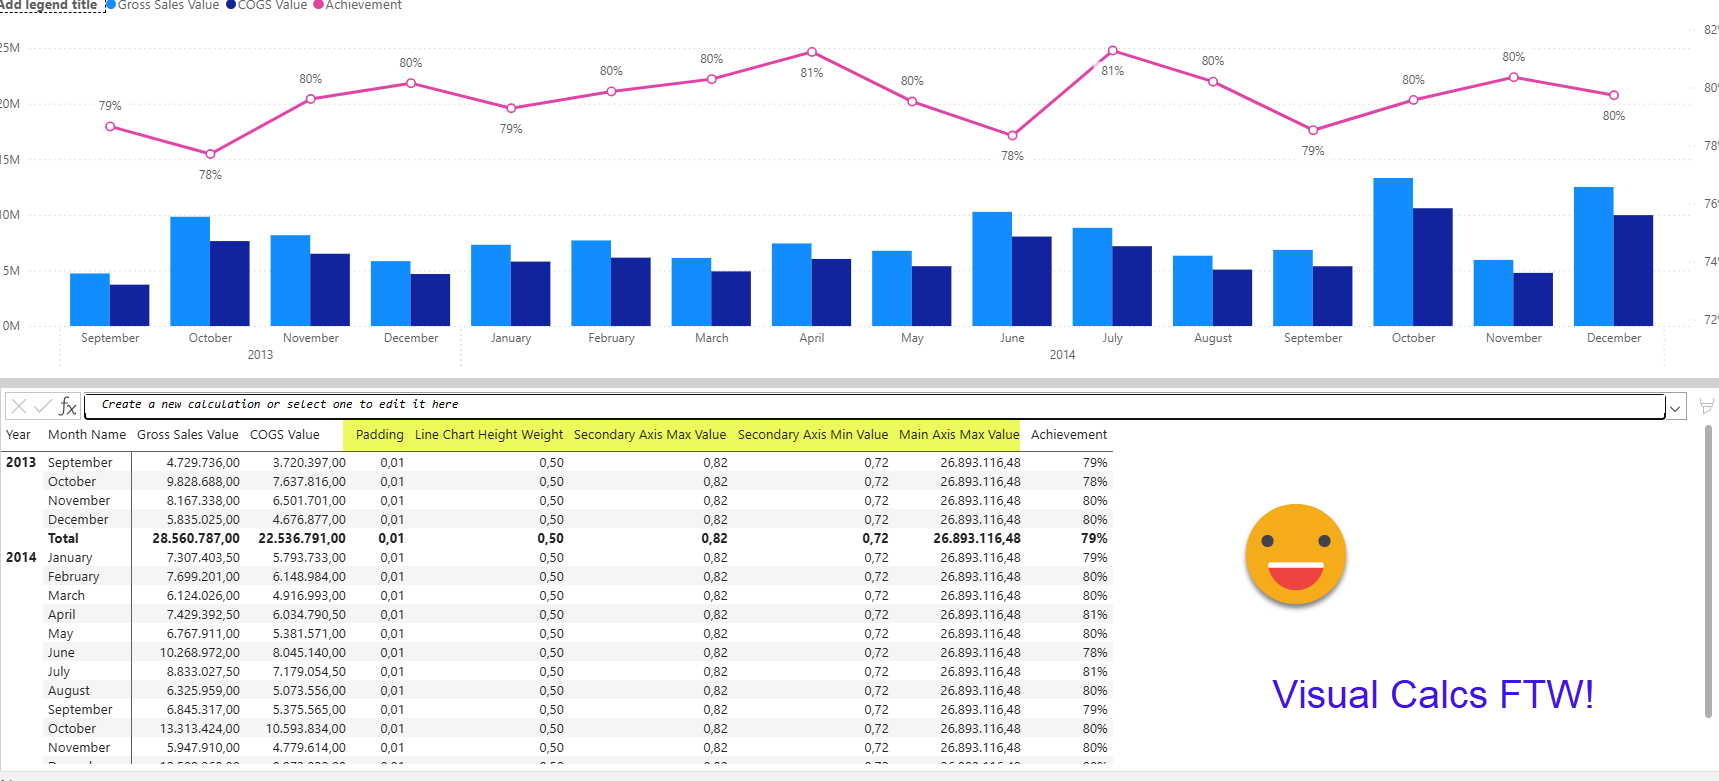
Here is the list of visual calcs and their expressions — Can’t wait for DAX UDF to encapsulate all this…
Padding = 0.01
Line Chart Height Weight = 0.5
Secondary Axis Max Value = EXPAND(MAXX(ROWS,[Achievement]),[Month Name],[Year])*(1+[Padding])
Secondary Axis Min Value =
    VAR lineMinVal = EXPAND(MINX(ROWS,[Achievement]),[Month Name],[Year])*(1-[Padding])
    VAR lineHeight = [Secondary Axis Max Value] - lineMinVal
    VAR secondaryAxisHeight = lineHeight / [Line Chart Height Weight]
    VAR result = [Secondary Axis Max Value] - secondaryAxisHeight
    RETURN result

Main Axis Max Value =
    VAR maxColumnValue = EXPAND(MAXX(ROWS,MAX([Gross Sales Value],[COGS Value])),[Month Name],[Year]) * (1+ [Padding])
    VAR result = maxColumnValue / (1 - [Line Chart Height Weight] )
    RETURN result
Now your boss comes and says, «you know what? In the Combo chart, the line instead of the moth achievement rate, I want to use the accumulated achievement rate of all time. »
Well, you are using On-Object Interaction, so you think this will take you 20 seconds. Just replace the measure, right? Wrong.
Let’s have a look:
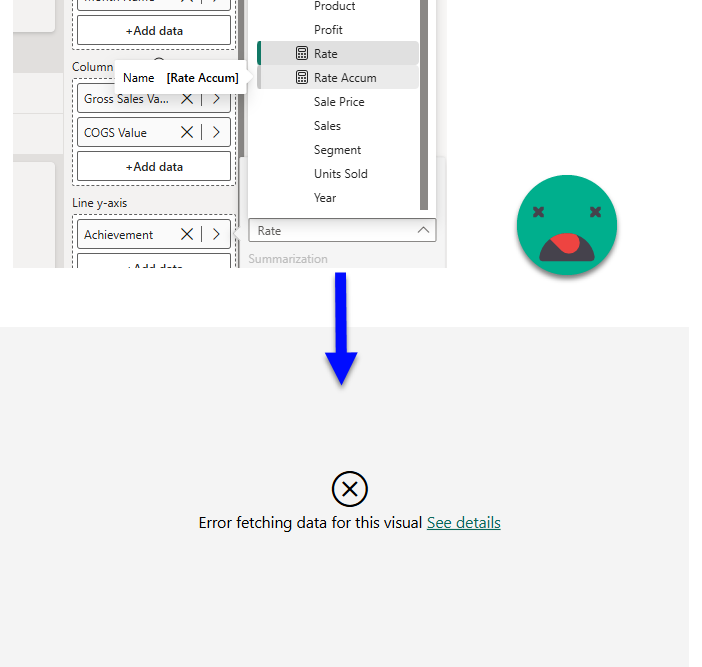
Ok, don’t panic. Let’s try to understand what is going on. Click on the «See details» and well, for once, the error message leads to the cause of the error.
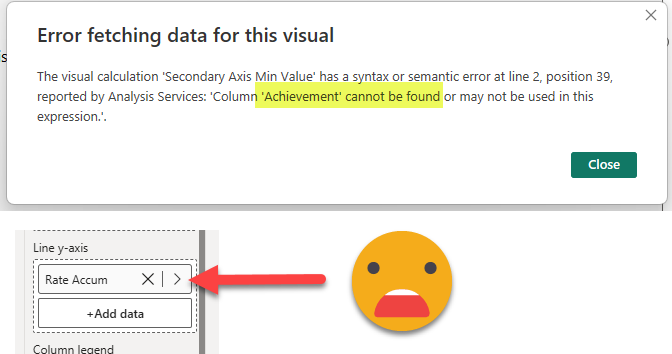
But the error is not really mine! It’s rather Power BI Desktop deciding that replacing a measure should reset the display name. And not only that, but resetting the display name and not fix the visual calcs that depend on it. Well, I’m not amused, but at least we can try to fix this by resetting the original display name (I hope you remember it!).
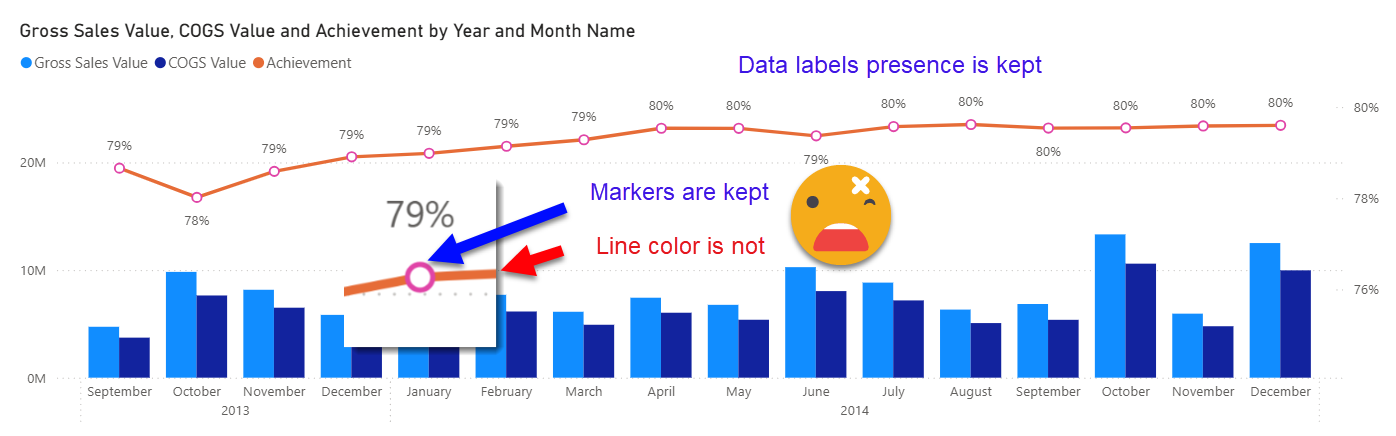
Well surprise surprise! The line color is not kept, but markers and data labels config is kept. So for lines in combo charts, display name and line color is not kept, while markers and data labels are.
I haven’t tested for all field locations in all visuals (I don’t work for Microsoft after all) but what is kept and what is not, is not consistent either. And it is, to say the least, inconvenient. Of course both On-Object Interaction and Visual Calcs are still in preview, so hopefully this will get fixed eventually by GA.
But for Power BI features, waiting for GA can be a long time. (Field parameters anyone?)
What if… we could just swap a field by another without doing all this manual fixes afterwards??
Well, lucky for you I just put together a new script that promises to solve just that. Before doing anything though. Save changes to your model and report before replacing the field to avoid overwritting the changes we’ll do to the visual.json files. Now connect to Connect to the model with Tabular Editor 2 with Roslyn compiler configured (or with Tabular Editor 3). Check the previous post on more details how to set this up. Now just follow this steps:
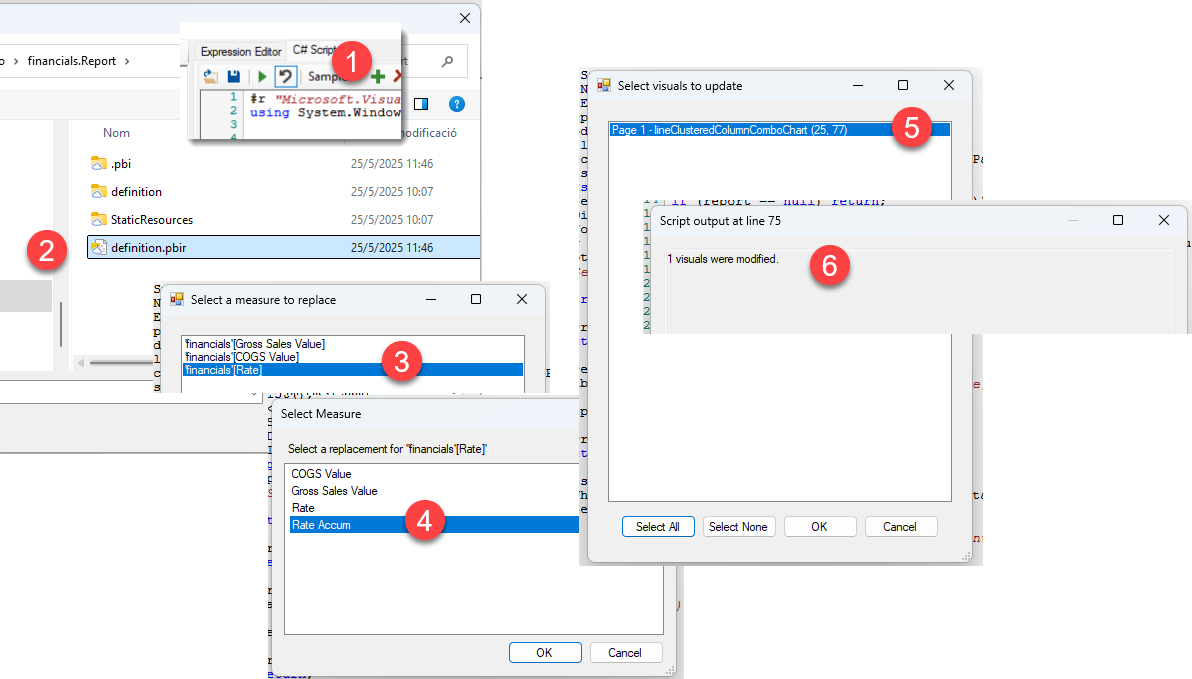
Step 1: Execute this script (it can be stored as macro too!)
Step 2: Select the definition.pbir of your report
Step 3: Select the measure to replace
Step 4: Select the new measure to use instead
Step 5: Select the visual(s) in which you want the swap to happen <— this is so cool
Step 6: Done!
Now close your pbix file WITHOUT SAVING CHANGES, and reopen to see if magic happened…
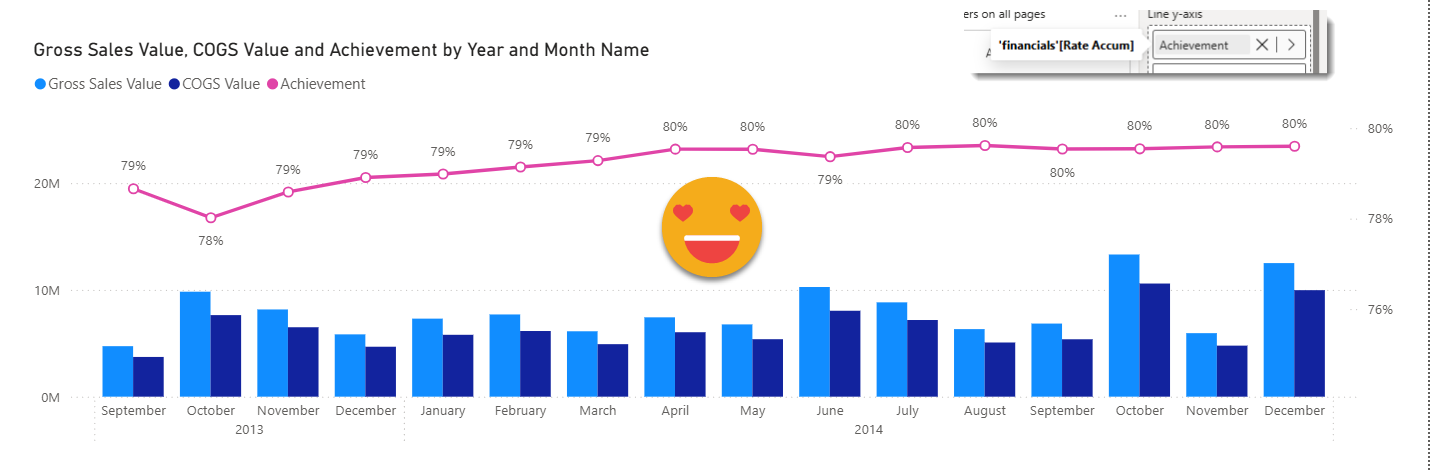
Bam! this is nice.
You might not like the fact that you need to change the PBIX and reopen to see the changes. I don’t like this either. So please go and vote for this idea. Maybe I should change the title to «Make a Copilot button to reload the report layer» so it makes it to the shortlist of ideas they consider though. Maybe I should just get some votes — it’s niche, but it should not be that hard right?
Let’s move on to the other script
Open the Visual.json file
So Microsoft recently enabled you to copy the internal identifier of the visual so you can go and search for it in your project. However, unless you are quite proficient in the use of VS Code, it’s not super easy to get to the actual file. I thought it would be fun to create a C# Script that could open one or more visual.json files in a more intuitive way.
The coolest part of this script is that it was literally a prompt on GitHub CoPilot chat and two or three tiny adjustments. This is quite bananas.
Just select the definition.pbir, select the visual or visuals, and off you go! It will open them in your default application. Using a quite large report by Erik Svensen where it shows so many use cases for visual calcs, it’s quite fun to use. The report can be downloaded here
Executing this script will show you a list, you choose one or more visuals and off you go! Easy and cool. The list will even include the title of the visual if it’s present.
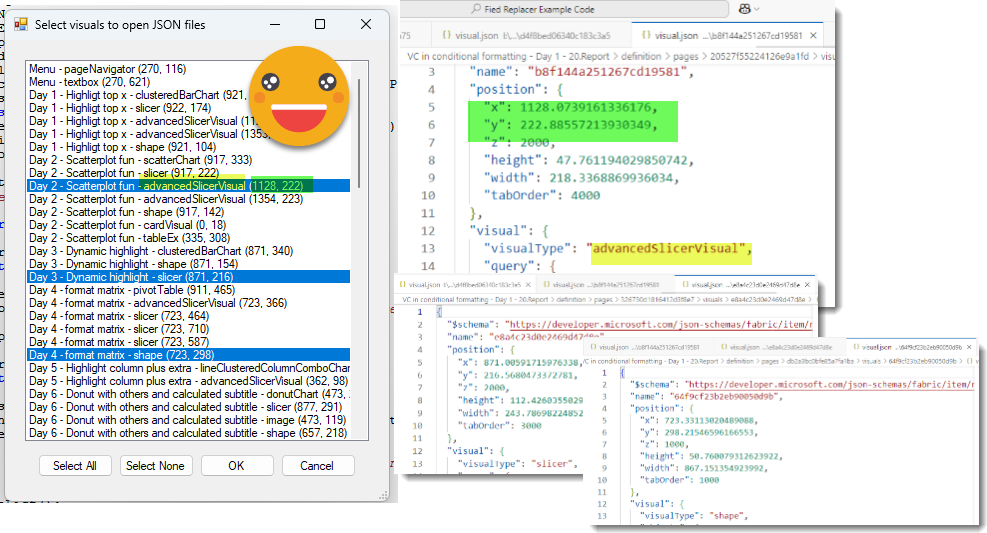
Isn’t that cool?
I love being able to create new scripts for the report layer with so little extra effort. The heavy lifting is already in place, so it’s just a matter of keep improving it. I’ve been adding some extra elements in the class to avoid losing info, and so far it’s good. Next I’ve been trying to keep things in the same order, to make it easier to see if the diff is ok or not. I added some «extra stuff» property in many of the classes so that it will not lose anything, but anything that is picked up by this will go at the end of that object, so there you might see some differences even though nothing has really changed. If it bothers you too much, you can always go and fix it in the code.
The repo to author code in VS Code or Visual studio is still public and open for anyone to use.
https://github.com/bernatagulloesbrina/TE-Scripting-in-Visual-Studio
If you have questions make sure to reach out to me and let’s figure out the best way forward.