C# Scripting Nirvana v2.0: Now with Reporting Layer!

This is quite crazy. I was trying to write a quick blog post to get back in swing over here, so I thought of a stream lineddd approach set maximum and minimum values for axis to properly show data labels, with a calc group and so on. Then it was impossible for me to sshow an example of the problem I was trying to solve. But then worse. I realized that you can now use visual calculations for those! So my approach was dobsolete before I presented it to the world. Of course I wanted to do something, and as usual I’m very much about automating stuff. Would it be possible to automate the creation of visual calculations?? Well, for that I would need to really parse the visual.json files of the new pbir reports. I have played around modifying the report layer before, but this time I had to do it for real. Instead of creating new stuff, I wanted to look at was already created! Time to tackle all those little jsons.
In this post I’ll explain how I authored a script that detects broken references in PBIR reports, asks the user for replacements, and then fixes the report. However, this is just the excuse, the way I wrote it opens the door to pretty much any script you can think of to modify the report layer. Let’s get started!
Where it all started
If you are wondering about the v2.0 in the title, you better go and have a look at this earlier article of mine. TL;DR I created a repo in which you can create tabular editor scripts with intellisense (and well with GithubCopilot and everything that comes with Visual Studio or VS Code). The repo includes a project for the main scripts (TE Scripts) and another one for code that can be reused, called GeneralFunctions. The repo also includes a macro to teach Tabular Editor to go and pick the bits necessary for the script.
I have since played with the idea of modifying the report layer in this article and this one. However in both articles I stayed in the safe side of things, just adding stuff to an existing report. The only bit modified was the pages.json. Everything else were new files.
The key of modifying an existing file is loading a json into a c# object and then back to json. This is achieved with some nice code:
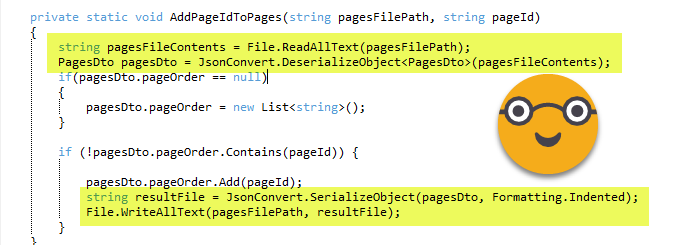
And who is this PagesDto? Is a custom class added at the very end of the script that builds this structure that makes it easy to modify the object before converting it back to a json file.
So far so good. But I only had this little bit of the entire report parsed for modification. And it was not well integrated with the TE Scripting in Visual Studio system. Every time I wanted to test I had to manually add the custom class at the end. This would be far from enough.

Some plumbing to go further
Before diving into the big problems, I needed a way to work that would not make me (more) insane. I needed that the macro that copies the code into the clipboard to be a bit smarter, and when needed it would copy the custom class as well. Next I realized that all the workarounds I did to write scripts need to be replicated for each class, so many methods could not be written inside the custom class. Yet putting them in the GeneralFunctions was not a great idea either. If the macro had nothing to do with PBIR, having all the code to initilize a report object did not make much sense. So I bit the pill and created a «ReportFunctions» project as well, to write the code that I want to reuse but yet it’s not convenient to write in the custom class. So for example anything that I need to have some info or error messages for the user, I will need to do it in the ReportFunctions because there I can use Info or Error functions native from tabular editor because I have some workarounds to be able to use them without any prefix that I would have to delete once I copy the code to Tabular Editor.All methods that just encapsulate accessing all the multiple properties are fine in the Report.Dto file.
Probably any conventional c# developer will scream at this modus operandi, but this is not conventional c# development
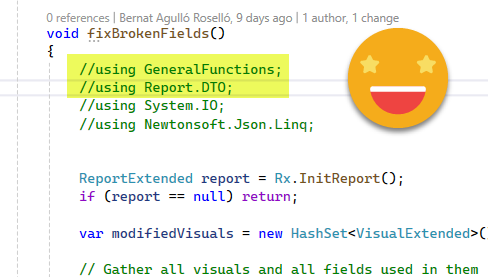
Anyway, after changing code here and there, now if I start a script and add the comment «//using Report.DTO» the macro will be smart enough to copy both the Report Function custom class (removing the final bits that make the coding experience smoother inside Visual Studio) as well as the classes of the Report.DTO namespace at the very end, and then I can just paste into tabular editor and execute right away without any manual modification AT ALL (this is very important to avoid going insane).
I know you are supposed to split things around in multiple files, but since my goal is o have a single script at the end, I do things a bit differently…If it works, it works.
After some usual trial and error the copy-pasting thing works. And in my code I just need to type «Fx.» if I want to use a method from general functions or «Rx.» if I want to use a method from report functions. Not too bad, huh? And of course with intellisense, github copilot and all the things.
Trying to eat the elephant in one go
Going back to the problem of dealing with the Json files of the PBIR format. It was clear I needed to parse each an every json file of the report, including the dreaded visual.json, by far the most complex ones. I asked chatgpt to help me create a class using the schema listed on top of the visual.json files. And to my amazement it did generate something that looked awesome. Then I went on and realized I would need an extended structure to store the paths of all those files as well so I could save the changes back to json files. Basically each type of json file would have its own «extended» object that would store the path and in some cases some methods I wanted to encapsulate. But let’s not get ahead of ourselves.
This is still not too complex. Here our «ReportExtended» class has a list of the pages of the report, the path of the pages.json, and the actual contents of the pages.json file, called PagesConfig here (the class is exactly the same PagesDto of the script I discussed before). ChatGPT was instrumental in setting this all up.
public class ReportExtended
{
    public IList<PageExtended> Pages { get; set; } = new List<PageExtended>();
    public string PagesFilePath { get; set; }
    public PagesDto PagesConfig { get; set; }
}
The PageExtended class is somewhat similar
public class PageExtended
{
    public PageDto Page { get; set; }
    public IList<VisualExtended> Visuals { get; set; } = new List<VisualExtended>();
    public string PageFilePath { get; set; }
}
We have here the Page which contains the contents of the page.json, a PageFilePath with the path to that page.json file, and a list containing all the Visuals.
Extra powers for TE2
Before we go deeper in the code let’s talk about c# versions.
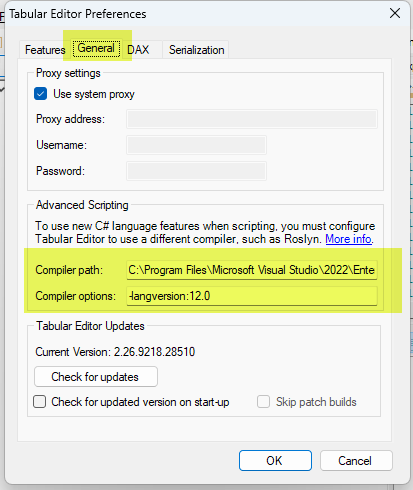
The way of initializing the Visuals or Pages objects in the previous classes is not supported with the standard C# 4 supported by TE2. But that’s not all (and still has a not-so-painful workaround). Later on I discovered that the LINQ expressions I needed are not possible either and there the workarounds were terrible. All this to say that, to be able to execute the script (or any Reporting Layer Script based on these classes) in TE2 you will need to configure the Roslyin compiler thing. The good news is that if you have visual studio installed you already have the Roslyn compiler in your PC. And if you want to develop cool scripts and you only have TE2 then you *need* Visual Studio.
Thankfully Daniel Otykier has recently updated the documentation to make this process as easy as possible. The link shows the two little things you need to fill in the configuration of TE2 for the magic to happen.
According to ChagGPT you can also get the Roslyn compiler downloading the .Net SDK in case you only want to execute the script and for some reason you don’t want or can’t have Visual Studio installed.
Parsing the jsons from Microsoft
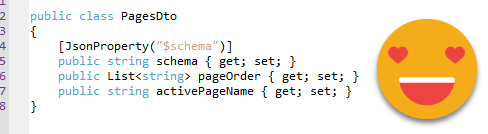
Going back to the classes, the PageDto and PagesDto are also very reasonable. To understand better how the classes and the jsons relate to each other, let’s revisit PagesDto. This is the class:
public class PagesDto
{
    [Newtonsoft.Json.JsonProperty("$schema")]
    public string Schema { get; set; }

    [Newtonsoft.Json.JsonProperty("pageOrder")]
    public List<string> PageOrder { get; set; }

    [Newtonsoft.Json.JsonProperty("activePageName")]
    public string ActivePageName { get; set; }
}
..and this is the actual json file:
{
  "$schema": "https://developer.microsoft.com/json-schemas/fabric/item/report/definition/pagesMetadata/1.0.0/schema.json",
  "pageOrder": [
    "7399bd42dacab028e046"
  ],
  "activePageName": "7399bd42dacab028e046"
}
You look at this and you think «I can do it».
The main gotcha are the lines that precede each element in the class. This JsonProperty thing must be there. The reason is that this is how it remembers the actual name when you bring it back into the json file. You see, 99% of the properties of these files are in lower case, but there’s a small percentage that are in Upper case for some reason or have a $ in the beginning like $schema, so you need to keep track of them this way. It’s great that ChatGpt did that for me. Of course it took a few goes until I realized that was an issue at all…
The page.json (one file for each page) is also very reasonable, even though I think this one gets longer if you use bookmarks and stuff like this. But by default is quite small and easy to parse.
The Beast: visual.json
The visual.json files are massive.
They are super nested and messy in general. but it is what it is. After all they have to store *a lot* of info and possible configurations. When diving in and trying to make sense of them it’s important to keep the mission clear. As a first priority I wanted get hold of all the places where a column or a measure may end up. You can have them in the main field wells (called «projections» here), but also as visual level filters, conditional formatting of many many things, as reference labels of the new KPI card, a detail of that reference label, as detail of the regular data labels in bar charts… I mean I’m probably missing a few of them, but I decided it was time to write the blog. TL;DR fields can be all over the place
Here the learning was that even chatgpt did not really want to parse everything. I guess even machines get lazy sometimes. ChatGPT made me compile the whole schema in a single file using command lines and stuff I would never do. At the end I had a 133kB file that is supposed to contain everything. Once I had this I thought it would do it, but instead I discovered that automated tools would only map the first level of properties, and chatgpt would not do everything either.
Rather than looking into the schema file, providing actual json files proved to be much more productive. Even then though, when ChatGPT saw like 8 levels of nesting (I’m not making it up, and the actual max number is more like 15) it would suggest leaving the object as a json object and deal with it in this form. I don’t know any better so I followed that path. However, it did not work for me. So I forced it to use explicit casting and create classes for everything it needed to extract those fields. And that did work.
Encapsulate all the things
The moment I started building the code to get the complete list of measures and columns used in a visual, I realized I wanted to encapsulate that somewhere, so my main macro would be easier to author and understand.
Since not all visuals contain all properties, the LINQ expressions you need to build are a bit trickier, using a lot of question marks, a little bit like you do in power query to navigate JSONS. This question mark thing though is not available in C#4 which TE2 uses by default. That’s why I said you will need to configure the Roslyn compiler if you use TE2 to execute the script. In TE3 you are fine.
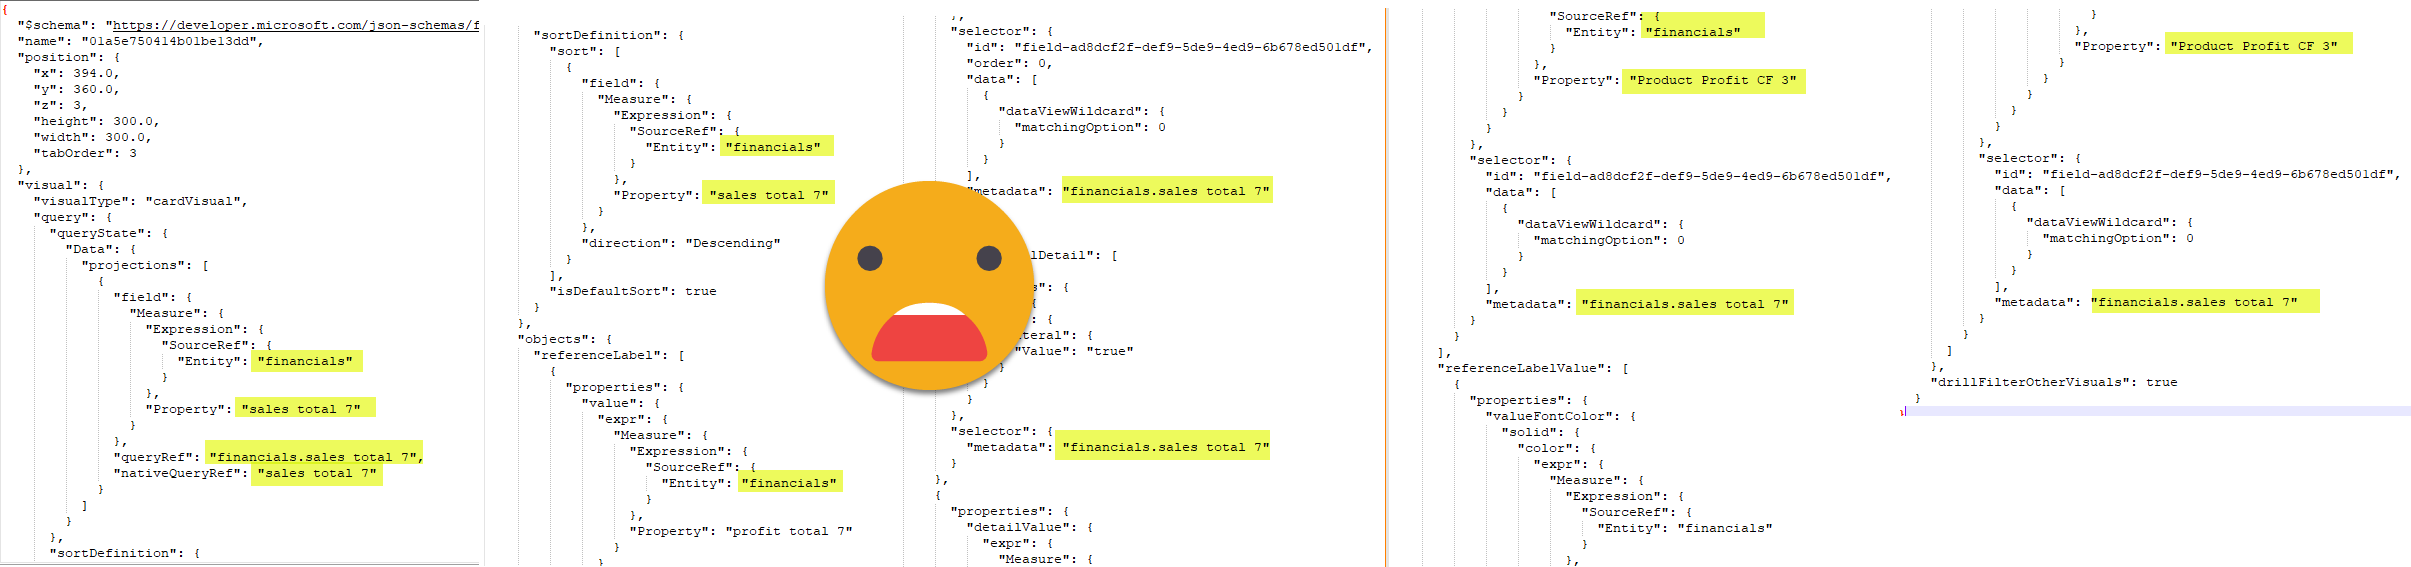
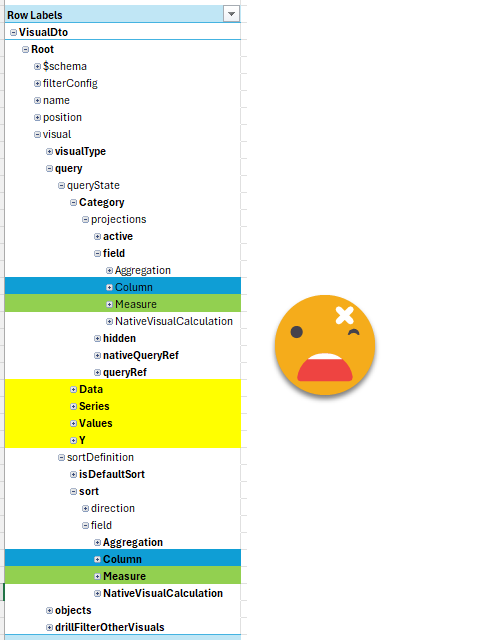
If you think I’m overstating it, here you can have a look at the class I built to parse the different places where the fields might be
if we look at the «QueryState» which is just the main fields of the visual and the sort. And this is already bad. All the yellow objects have the same underlying structure as the one shown so could have either measures, columns or both as well.
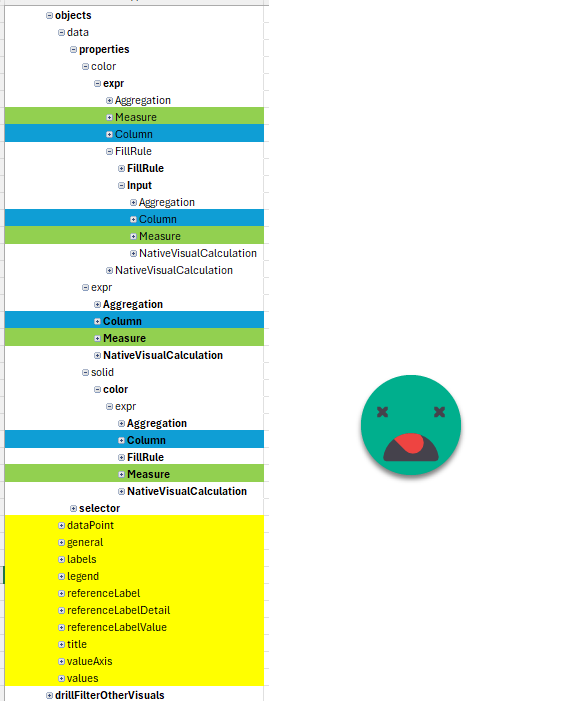
However, the «object» section is even worse. Here is where we have all the conditional formatting, reference labels and a long long etc.
All this to say that you don’t want to repeat the code to check wherever a field might be. You just want to do this once.
That’s why I (well, mostly ChatGPT) built a couple methods to get the fields from all these different places
The detail of the code is a bit too much, but just so you get an idea,
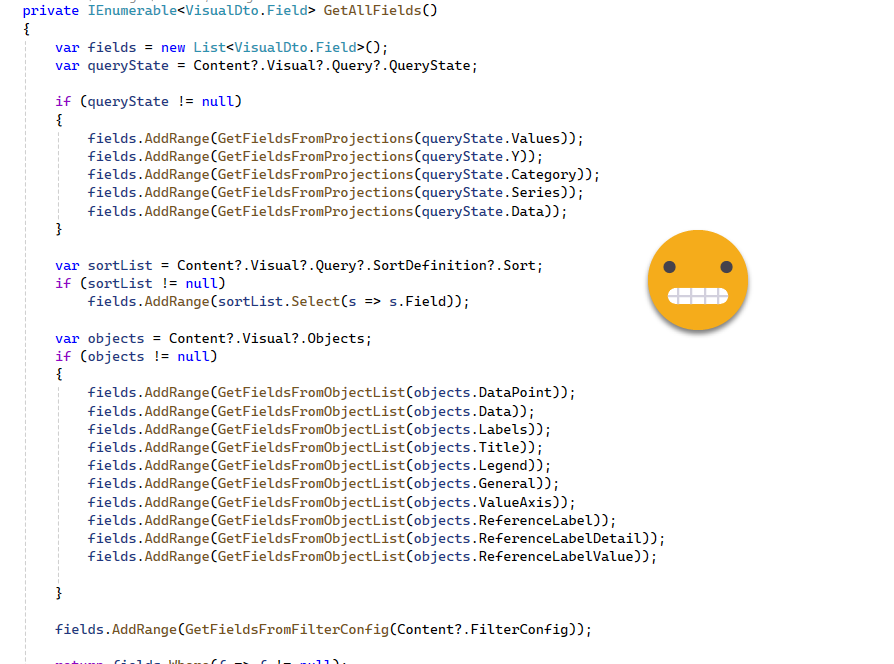
Here you can see the use of question marks — these is like saying «if not null». Very handy. A little bit like in PowerQuery right? Well maybe it’s the other way around
This code is the process that is reused by two smaller methods that filter by measures and columns. The reason is that you want to check columns (used in the report) with columns (in the model) and measures with measures. Otherwise you could have false positives.
Parsing the whole thing
Let’s say that by now we have the structure, but we sill need to fill it up before being able to do anything meaningful.
The very first step was to initialize the whole «Report» object so I can forget about the actual json files until I need to save changes. Since I want to use some native functions from Tabular Editor that need a workaround for each class I created that in ReportFunctions.
It’s a bit long for the blog but it’s they key of this article. The idea is that you have THE WHOLE REPORT in an object and you can go up and down iterating and changing any properties you need to change. At the end you can save the changes back to json. How cool is that?
Again, this is a method in ReportFunctions:
// Get the base path from the user
string basePath = Rx.GetPbirFilePath();
if (basePath == null)
{
    Error("Operation canceled by the user.");
    return null;
}

// Define the target path
string baseDirectory = Path.GetDirectoryName(basePath);
string targetPath = Path.Combine(baseDirectory, "definition", "pages");

// Check if the target path exists
if (!Directory.Exists(targetPath))
{
    Error(String.Format("The path '{0}' does not exist.", targetPath));
    return null;
}

// Get all subfolders in the target path
List<string> subfolders = Directory.GetDirectories(targetPath).ToList();

ReportExtended report = new ReportExtended();
report.PagesFilePath = Path.Combine(targetPath, "pages.json");

// Process each folder
foreach (string folder in subfolders)
{
    string pageJsonPath = Path.Combine(folder, "page.json");
    if (File.Exists(pageJsonPath))
    {
        try
        {
            string jsonContent = File.ReadAllText(pageJsonPath);
            PageDto page = JsonConvert.DeserializeObject<PageDto>(jsonContent);

            PageExtended pageExtended = new PageExtended();
            pageExtended.Page = page;
            pageExtended.PageFilePath = pageJsonPath;

            string visualsPath = Path.Combine(folder, "visuals");
            List<string> visualSubfolders = Directory.GetDirectories(visualsPath).ToList();

            foreach (string visualFolder in visualSubfolders)
            {
                string visualJsonPath = Path.Combine(visualFolder, "visual.json");
                if (File.Exists(visualJsonPath))
                {
                    try
                    {
                        string visualJsonContent = File.ReadAllText(visualJsonPath);
                        VisualDto.Root visual = JsonConvert.DeserializeObject<VisualDto.Root>(visualJsonContent);

                        VisualExtended visualExtended = new VisualExtended();
                        visualExtended.Content = visual;
                        visualExtended.VisualFilePath = visualJsonPath;

                        pageExtended.Visuals.Add(visualExtended);
                    }
                    catch (Exception ex2)
                    {
                        Output(String.Format("Error reading or deserializing '{0}': {1}", visualJsonPath, ex2.Message));
                        return null;
                    }

                }
            }

            report.Pages.Add(pageExtended);

        }
        catch (Exception ex)
        {
            Output(String.Format("Error reading or deserializing '{0}': {1}", pageJsonPath, ex.Message));
        }
    }

}
return report;
Of course as we saw, iterating the object «as-is» is a bit to complex so that’s we have some methods that hide some of that complexity from your main script.
Finding broken fields
Anyway, after some initial testing of changing the X and Y of a visual, I went all-in and tried to detect the broken references by gathering all the used columns and measures and compare them with all the columns and measures of the model. If a something used is not in the model… it’s broken!
This part looks deceptively easy:
ReportExtended report = Rx.InitReport();
if (report == null) return;

// Gather all visuals and all fields used in them
IList<VisualExtended> allVisuals = (report.Pages ?? new List<PageExtended>())
    .SelectMany(p => p.Visuals ?? Enumerable.Empty<VisualExtended>())
    .ToList();

IList<string> allReportMeasures = allVisuals
    .SelectMany(v => v.GetAllReferencedMeasures())
    .Distinct()
    .ToList();

IList<string> allReportColumns = allVisuals
    .SelectMany(v => v.GetAllReferencedColumns())
    .Distinct()
    .ToList();

IList<string> allModelMeasures = Model.AllMeasures
    .Select(m => $"{m.Table.DaxObjectFullName}[{m.Name}]")
    .ToList();

IList<string> allModelColumns = Model.AllColumns
    .Select(c => c.DaxObjectFullName)
    .ToList();

IList<string> brokenMeasures = allReportMeasures
    .Where(m => !allModelMeasures.Contains(m))
    .ToList();

IList<string> brokenColumns = allReportColumns
    .Where(c => !allModelColumns.Contains(c))
    .ToList();

if(!brokenMeasures.Any() && !brokenColumns.Any())
{
    Info("No broken measures or columns found.");
    return;
}
Just create a list for the measures & columns used in the report, do the same for the model and compare them! The tiny gotcha is in «allModelMeasures». In general we use measure names without table prefix, but in this case we need to force it because visuals will break in the thin report if you change the base table in the model, so you need to compare the whole thing. From the report we also extract table+measure as well.
Of course the script goes on. Now that we have some measures or columns broken is time to find the replacements and update
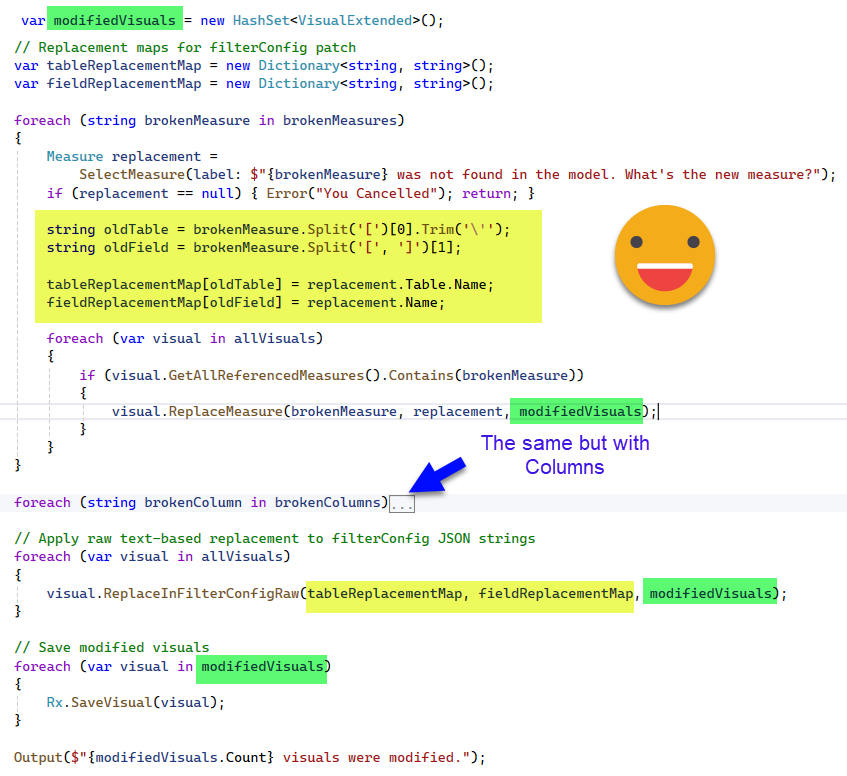
Here the algorithm is deceptively easy. GetAllReferenceMeasures and GetAllReferenceColumns (hidden in the second block) we have already seen earlier that they hide the complexity of going through all the objects that may contain a column or a measure. We have not seen the «ReplaceMeasure» (and ReplaceColumn counterpart), but again, it’s a matter of going through all objects and changing the references to the brokenMeasure or brokenColumn and from there use the new ones. Whenever this happens the visual is added to the modifiedvisuals hashSet which apparently is some sort of collection.
You might be wondering why the FilterConfig goes aside. I might be wrong but in my discussion with ChatGPT I was told that it’s not quite strongly typed so it’s not that straight forward to parse as the rest of the json. So instead of dealing with the json object it just converts it back to a string and does a good old replace of the oldTable by the newTable and the oldFieldName by th newFieldName. It can lead to false positives? Yes. Am I selling this as a commercial product with warranty? No. I figured out this was good enough for now, and in any case, CHECK YOUR DIFFS on your git to check that everything looks ok. Then Open the report and make sure everything is OK. Then do the commit.
Also important is to track which visuals have been indeed updated, we don’t want to save all the visuals of the report, because that will generate a lot of noise. Even with both files being the same report, the order in which properties have been listed may differ and that generates a lot of differences between files. I’ve checked and did not see anything too bad, but again, check your stuff.
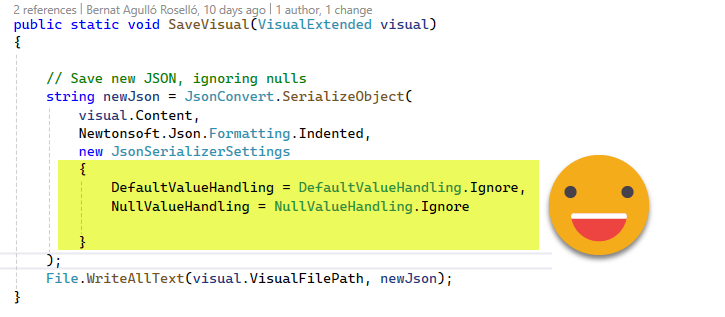
Last but not least I want to highlight the SaveVisual method. For the visuals, the class is much more complex than the actual json file, meaning it has many properties not implemented in the json. I had a lot of trial and error until I managed to get a good answer from ChatGPT. Turns out I needed some parameter to tell it to not generate anything if the property was null, thus leaving something very close to the original json.
show it to me!
Let’s get to the final result: The script
If you want the whole thing to modify it (without going insane) and also develop your own scripts: The Repo
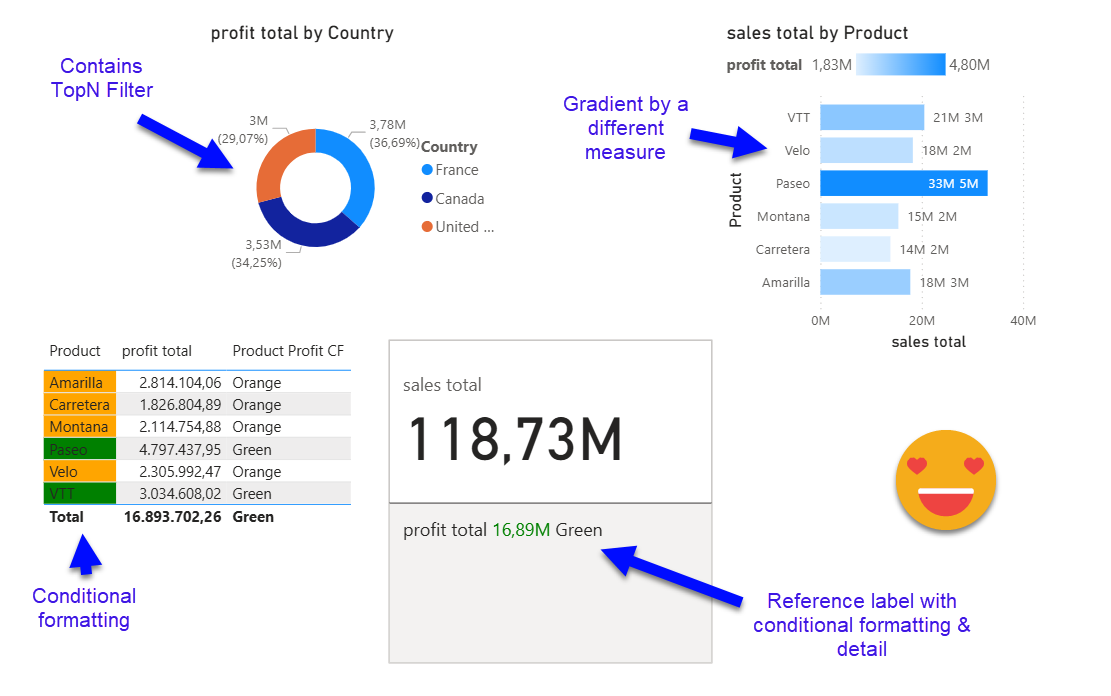
I created a blank report and loaded the sample «financials» demo data. There I created three measures (tmdl scrit in case you want to replicate).
createOrReplace
	ref table financials
		measure 'Product Profit CF' =
				VAR profit_average = CALCULATE(AVERAGEX(VALUES(financials[Product j]),[profit total]),ALLSELECTED(financials[Product j]))
				VAR current_profit = [profit total]
				VAR color = IF(current_profit>profit_average,"Green","Orange")
				RETURN color
		measure 'profit total' = SUM(financials[Profit])
		measure 'sales total' = SUM(financials[Sales])
Then I published it to the service. I used PBIP format with PBIR but for the semantic model it does not really matter.
Now I generated a beautiful thin report connected to the published semantic model.
Before doing anything else, save it as PBIP with PBIR enabled, and why not, initialize the GIT on the folder so you can check the differences.
Let’s open TabularEditor (2 or 3 your choice) connected to the semantic model (the one in the service or the one in Desktop — as long as they are the same it does not matter)
If you run it with TE2 remember to set up the Roslyn compiler (scroll back to the matrix meme for the link to documentation)
You can go ahead and even store it as Macro, it works!! (even though macros have more syntax restrictions than recular c# scripts!)
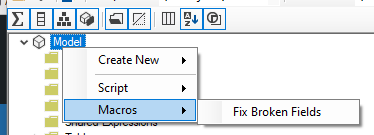
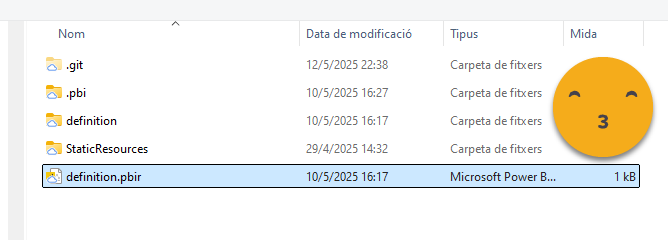
We can run our script and it will tell us that all is good. Remember we need to point to the PBIR file inside of Report Definition folder, not the root pbip file (which is just a shortcut to it actually)
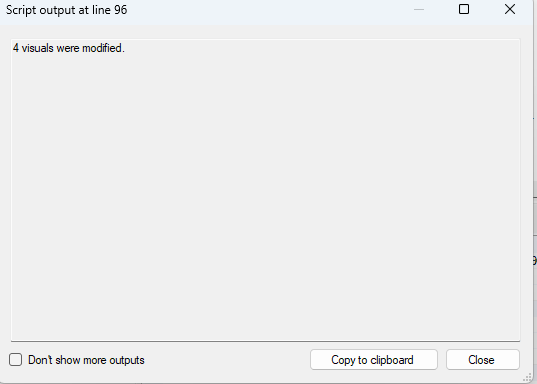
and sure enough:
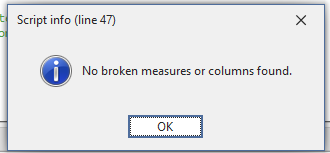
Next some rogue developer in the semantic model changes the measure names and even the name of the two fields used in visuals, adding a 2 to each of them and publishes the model to the service.
Without closing the thin report, you can just click refresh (which refreshes the metadata) to see the damage
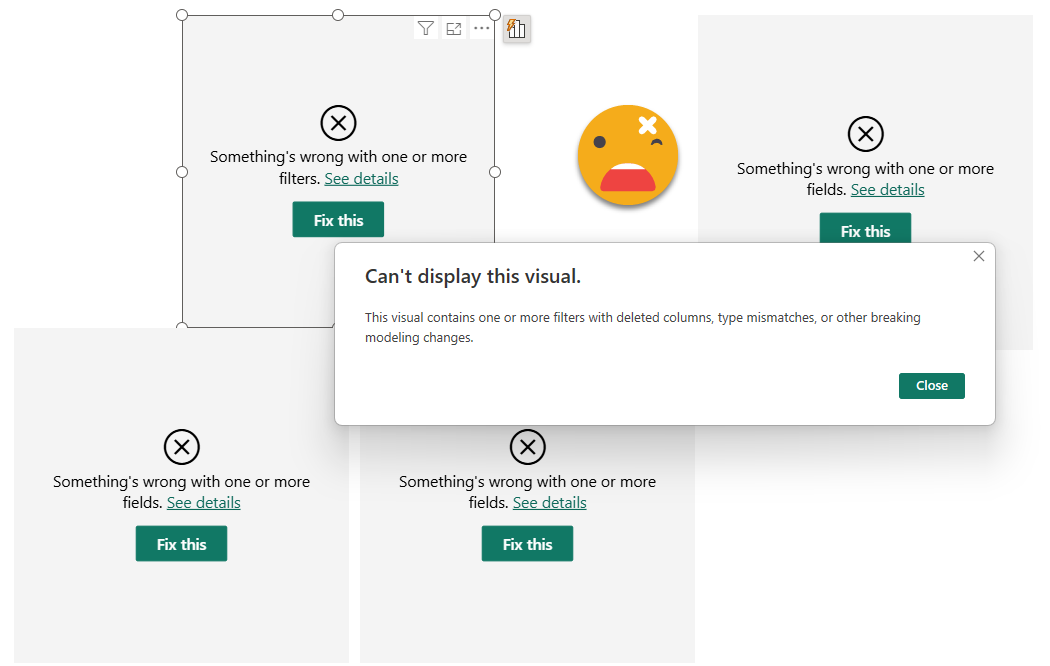
Now is time to close this report (to avoid accidentally save changes when closing later), and fix it with the script
When we run again the script, we get a different story
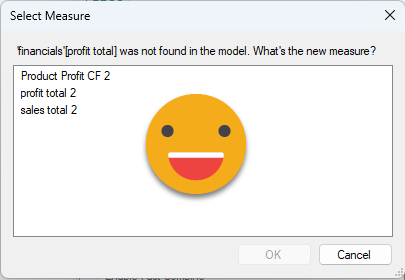
We select «profit total 2» and we go on. In case only the base table has changed it will show up as well, select it and go on (internally it has the right base table and it will update it in the visuals)
After the measures it continues with the columns and then we get the final result (might have to change it to an Info box…)
And now the big question. Did it fix the report??
Well we can first have a look at our git and see the changes there…
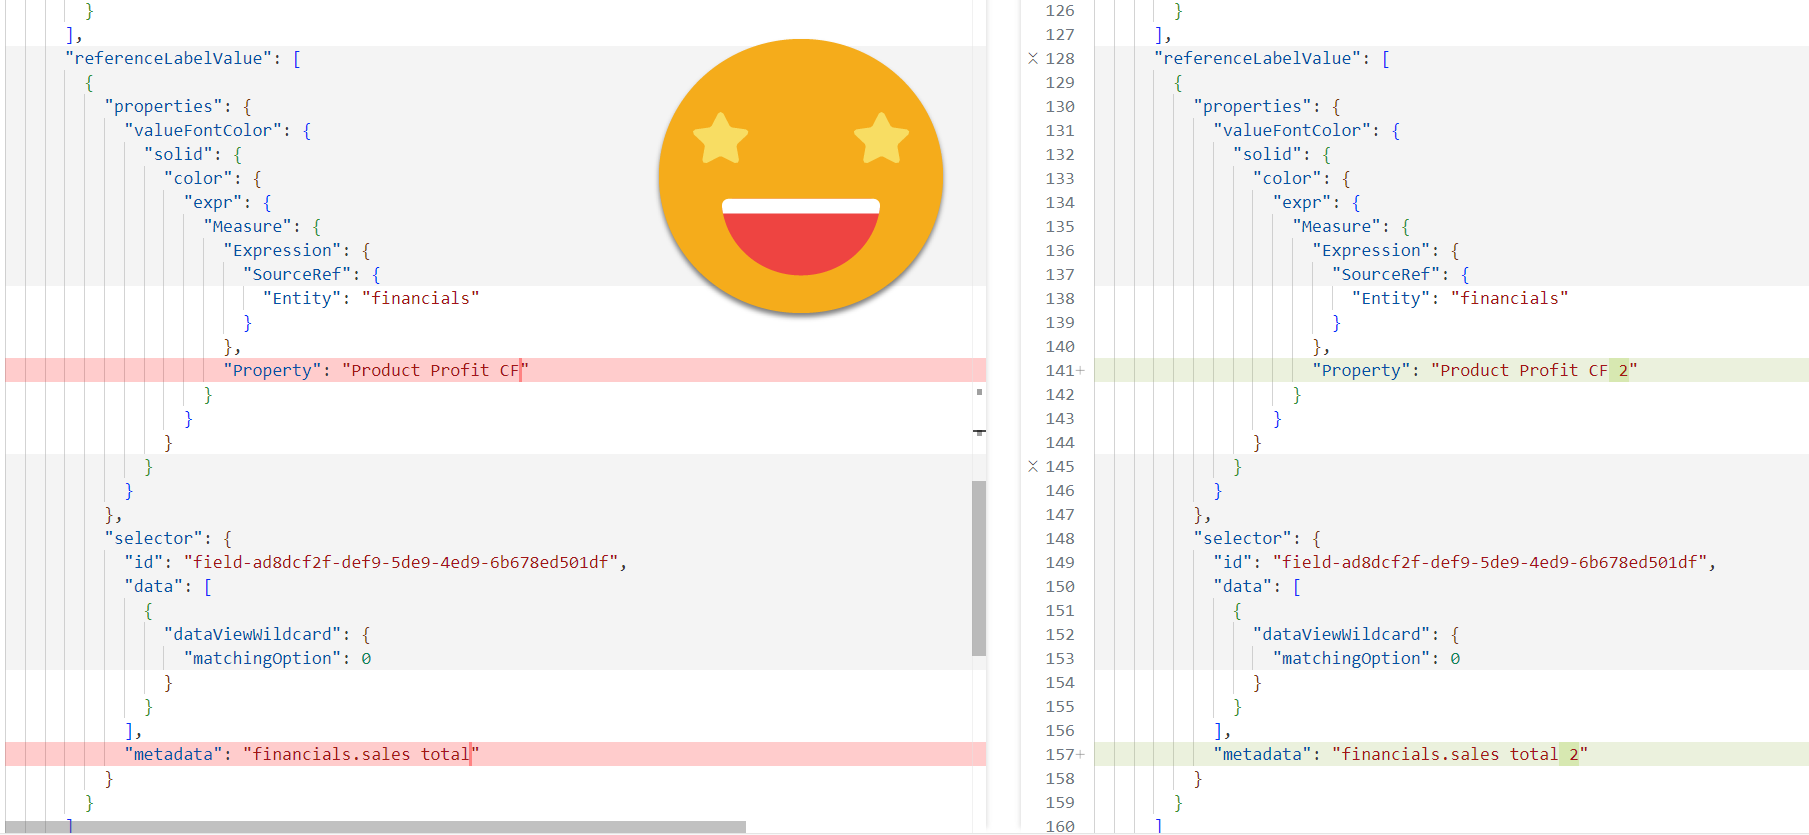
This is good! Even on very nested structures it was able to modify the references. It looks easy now, but it was not. Even with ChatGpt on my side most of the times.
At this point you might be saying

Ok ok, let’s open it back
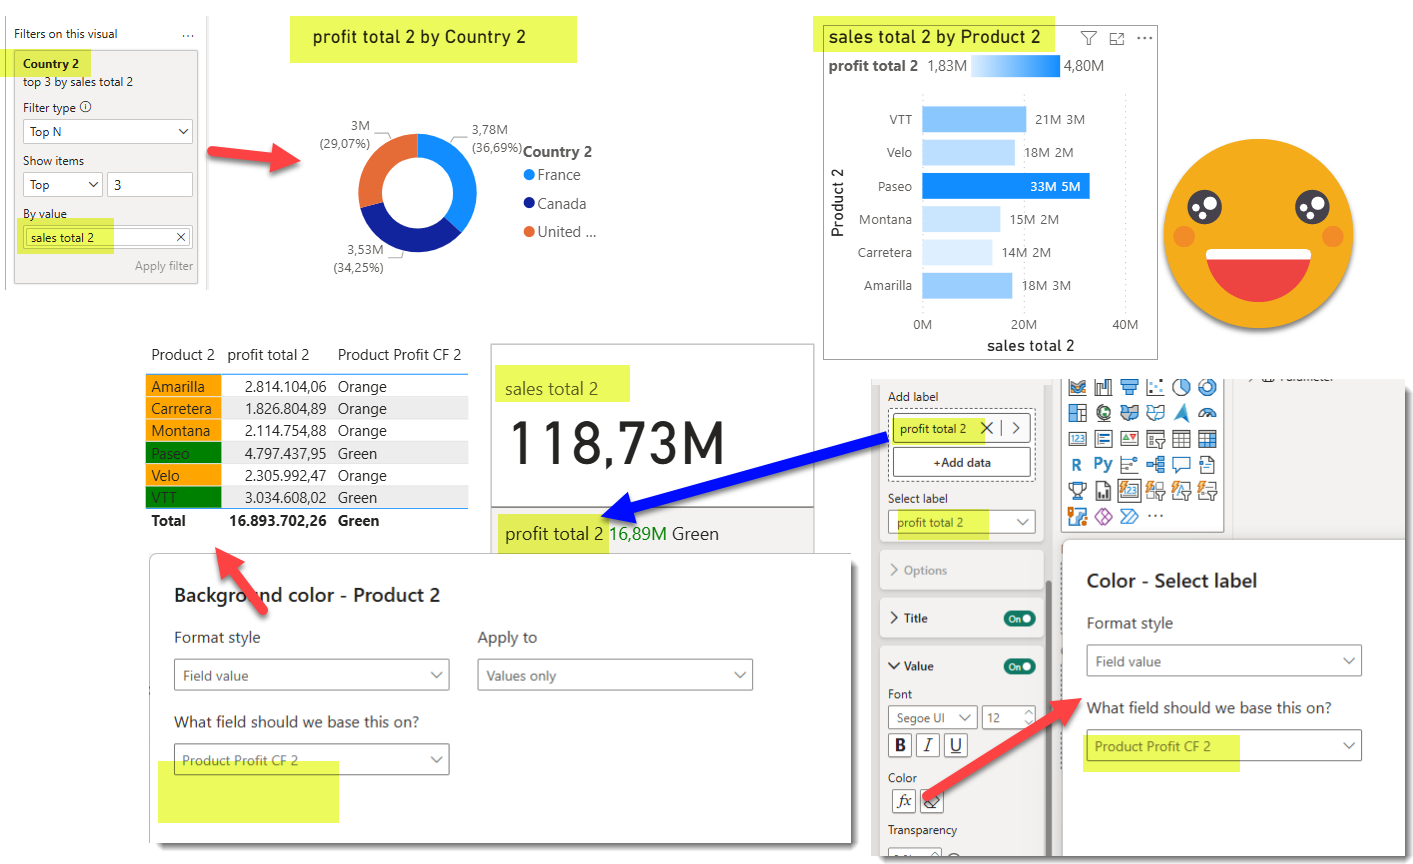
IT WORKS! all columns and measures have been correctly replaced.
Like anything cool there’s the small print at the end that waters down the joy. The limitations. Since this does not sound great sometimes they are called «Feature gaps» nowadays
- Works only on PBIP format with PBIR enabled. Nothing else
- You may run it on a report on top of a composite model, but it will not fix dependencies of your local model, sorry. To be honest I’m not sure if things break in this case — the do have some lineage tag right?
- It might not catch all the weird places where you have fields and columns. From the top of my head, filters on pages or all pages will not be analyzed. But you should be able to fix it manually. Or you can improve the code and contribute too, of course! Or wait until I need it to work and I update it.
what now?
At this point you might be a bit overwhelmed, but at least I hope you know that now much more is possible.
You might feel like Woody in this meme, but…
… think about it! With pretty much the same algorithm it will be possible also to add template visuals into any page of your report, or even a new one. All without those terrible templates of my previous articles. Just create a nice visual somewhere and just use measures that will show the intent inside the visual [main kpi], [previous year value] and so on. Of course making sure that you have all the measures ready for importing the visual will be a tricky one, but remember you are also connected to the model, so if needed you can also generate the measures at that moment.
Anyway, it’s a topic that I think will expand some more articles at least. All the tedious preparation of the report to make it bilingual, for example, now feels within reach!
And the good news is also that quite a lot of the limitations of PBIR are being lifted, so GA must be getting closer. Of course, stay cautious, and if something does not work exactly like you want, just open your favourite LLM and expand the code!
Support a new era of development!
for the Report-layer scripts to take off (and bring everything to the next level) if would be great if Microsoft did their part. I’ve posted a couple ideas that could really make a difference. Vote for them if you think the same way!
Thank you for reading all the way until here! It’s been quite a ride.
Continue the conversation on LinkedIn and Bluesky