Our Blog

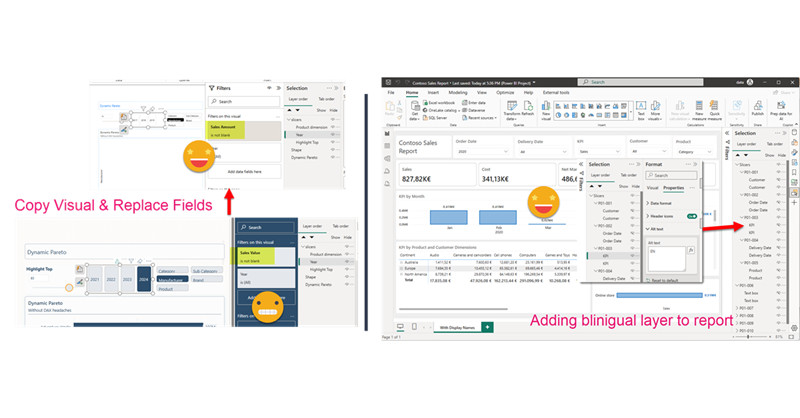
Hello again. Today I’ll introduce two new Tabular Editor C# Scripts that might help you at some point if you are already using the PBIR format (which is in preview, so don’t rush it!). The first one is to copy a visual, which at first does not look impressive, but remember that swapping fields in Power BI desktop breaks many more things that you would expect. Next we’ll see a script I built for myself if I ever have to make another report bilingual. The initial report preparation phase is now automated. That’s only part of the work, but still it’s an nice improvement.

Let me copy visuals and configure them for my report

Copying visuals between reports is one of the few things that you can actually do in Power BI Desktop out of the box and it kinda works. Well it works if your model is *exactly* the same. If you need to modify any field, chances are that you will break quite a lot of your formatting or visual calcs that depend on that field (as we saw in my previous post).

So what is to be done? Well I’ve come out with a new script that is not that different than the one on fixing broken fields. This time we’ll take a visual from one report, and we’ll add it to our target report. In the process it will confirm what field (column or measure) is to be used for all the fields that the visuals may have in any* place. (*no guarantees, but I try).

For this demo I downloaded the wonderful PBIX that Erik Svensen shared on how to use Visual Calcs in very different ways (you can check it out here).

Of course before going forward I saved it in a new folder in the PBIP format (and the PBIR preview feature also enabled).

I looked at the model and looks quite a contoso model. Next I went to my blank report, also based on a slightly different contoso model. I realized that Erik’s model had quite a few numeric parameters and some field parameters, or even some extra tables like comments that where directly typed in power query. So using TMDL View I extracted all the code for those tables in Erik’s file and pasted it on mine. And it worked! Field parameters needed some adjusting after applying the code due to the different field names, but no big deal.

You don’t need to do this, but of course you will need to provide replacements for all the different elements of the chart, so lookout for all this disconnected tables and the like before copying the visual.

Then of course I saved it as well as a PBIP project with PBIR enabled. Right after that I initialized the repo on that same folder. After all that’s the whole point of the PBIP format, right? By the way, if you don’t have the options of «open in VS code» for files and folders, you are missing out (check out this page to get it)

It is not necessary per-se but it is very convenient to see what changes happened to a visual after a manual modification, or even better after a modification with a C# script. If the file fails to open, you will need to dive in here and figure out what is wrong too.

Well, once you know what visual you want to copy and you are more or less sure you have replacements for all the fields used in the visual you are ready.

Now is the only tricky bit. After saving your target project, you need to open Tabular Editor from there, as it will need to check what columns and measures are available to replace those of the template file. So let’s do it!

You can find the script here. Like all my scripts for the report layer (with the exception of my first two) you will need to configure the roslyn compiler if you are using Tabular Editor 2. If you are in Tabular Editor 3 you are good to go.

Copy the code, paste in the C# tab, and store as macro in the model context (just because it’s always visible and easy to reach).

As usual I had some code that I thought it worked reasonably good, but then I extended a bit the functionality and in the processes I found some flaws in the original one. I have extended the functionality to work well with more than one visual and even with visual groups, which are tricky because of the dependencies between different objects, which now will have different Ids…. Why am I modifying the Ids? after all it’s highly unlikely that the target report will have the same id already used right? Well, unless you are creating more than one copy of the same visual. So new ids it is!

Alright, alright, let’s execute the script

To make things a bit more interesting, I grouped the slicers on page one to proof that my script can handle that. You will see that the central slicer has even an object level measure value filter. These are quite tricky to parse. So much that is the only part where I desisted from parsing and I just run some brute force replacements on the original json file by table name and field name separately. A bit dangerous, I know.

My target report, at the same time is completely empty

So again, with tabular editor connected to the semantic model of the target report, let’s execute the script. We are greeted with a list box that this very first time only has «Browse for new file»

Click OK and you will need to find the PBIR file of your «Source» report, aka template report. The one that has the visuals you want to copy.

When you need to choose the target report you will see that the list now contains the template report path! Yes, it’s a «Recent PBIR files» list! As I was testing over and over report-layer scripts I introduced that little bit as a quality of life feature for myself. Just we aware that it reorders them rigorously, so the last one you clicked on will be the very top one the next time. It can hold up to 10 different paths.

After selecting the target report, now a list of visuals shows up, including visual groups (last selected item). Let’s select all the visuals from page one, and see if it can reproduce them in the target report.

Once this selection has been made, we need to tell it the destination page for all the visuals. It can either be an existing page or a new one. In case you choose a new one it will recreate the first page of the report (without visuals) and then it will copy all the visuals there. For now we’ll select page 1.

It’s now finally time to tell the replacements for all the measures and columns used throughout those selected visuals. The way it will to it is measures and columns of the first visual, then it will continue with the next, but it will only ask for any measure or column not present in the first visual, and so on. Remember that visual level filters are the weak point. It will not ask about columns and measures only used for filtering the visual. It’s on the roadmap they say.

So for instance, we’ll select Sales Amount to replace Sales Value

If the column or measure exists with the exact same name, it will be already preselected and if that suits you, you can click OK. (it’s a bit weird that TE2 does not show the table name of the column, in TE3 it works fine)

After a few more question-answer we reach the final message

Now to check if that really worked, close your target report WITHOUT SAVING CHANGES, and reopen again. So is it working?

It is working!! Took me a while to get it all working but it’s good that it finally does work. And why is not showing any data??? Well, that’s because the original filter was selecting 2024 and in this model there’s only data until 2019 so, nope, no data. But that’s part of your job when setting up your report. In this one all the visual calcs and all the little tricks are already there so you can focus on how you want to leverage it. Why are colors off? Well that’s due to the custom theme of course. This is something that you should not have to do because you should be using a template right? Of course that could also be done in a macro, but I don’t think it’s worth the effort. For leveraging cool uses of visual calcs or complex visuals with several fields, it is sure worth it.

What was the other script about?

Well, it is quite a niche use case, but useful to show the power of these report layer scripts. If you have not read part 2 of how to make a report truly bilingual, now it’s a great time to do it. In short, for all visuals that contain text, in any form (including text boxes!) you will need to :

  • Copy and paste the visual
  • Place it exactly in the same position
  • Add some flag text in the beginning of the ALT TEXT of the original visual only
  • Group both visuals
  • Give the group a name following certain convention
  • Hide the original visual.
  • REPEAT FOR EACH VISUAL IN THE REPORT!

As you see it’s not terribly complicated, but quite time-consuming and very very boring. (Writing this blog is time consuming but at least it’s not boring). Even when I wrote that article I pleayed with the idea of one day being able to automate that bit of the process at least. Well now it’s possible, if you are using PBIR format. On my project I used PBIR only as sort of an «export to» format, so no chance of doing it with a script, unless your are the fusion of Kurt Buhler and Matthias Thierbach.

As starting point I took one of the pages of the report I used to show how to make a report bilingual. Of course, in this case I took the page that was not yet fully bilingual and had already some proper display names and custom titles to make visuals easier to understand. This could be a starting point, but in most cases it’s going to be much, much more complex.

Like in the previous script I grouped some visuals to proof that the script can handle that. In this case we are not going to look the model at all, so you can run it from tabular editor connected to any model you like, even a dummy model.bim you can have in a folder. And even more important than in the previous use case, let’s initialize the repo, so we can see exactly what changes are done by the script.

First things first, get your script here.

The execution itself is very straight forward. It will require only to specify what’s the text flag that will be added at the beginning of the ALT Text field. If you go back to the article you will see this is how you identify the original visuals and those that need translation so to say.

Next it will tell you how many visuals where created (not counting the visual groups) and that’s it. When you reopen the file, you should see something like this. To see that the alt text flag was added you will need to make the visual visible first.

As usual I thought advancing it a bit more and create a single bookmark to show all original visuals and one to bring it back to the default, but looks like as a melon too big to open it now. After all you can create a bookmark the way it shows up when you open it after running the script and this should be the default when publishing. then you can reveal any visual that needs editing on the original and once you are finished you click again on the default bookmark to hide it again along with the rest.

So let’s call it a day!

I’m still wondering whats the best way forward for automating the report translation. One possibility is to find some way of replicating the files of the repo into the lakehouse and then run a pyspark notebook to extract the required bits in a tabular form as we did with Dataflows gen2. Another alternative approach is to do the extraction with a c# script as well but I also need to think on the easiest way to bring the file into the lakehouse to continue with the process. If I ever continue with that I’ll let you know which way it went. Deciding which fields need translation and which ones do not might not be 100% straight forward, but once all the tables are ready, bringing it back to the report, could be another fine use case for some scripting. Tricky part is that not all visuals accept field parameters. But even if It could do just 80% of the visuals it would be a game changer, if making reports bilingual is your thing of course.

Thank you for reading all the way here.

Let’s continue the conversation in LinkedIn and Bluesky.

Contacto

Contacta con nosotros y descubre el poder de la información.

Nombre
Email
Consulta

Ok! Mensaje enviado.
Error! Verifica los campos.
© Copyright 2022 - Esbrina