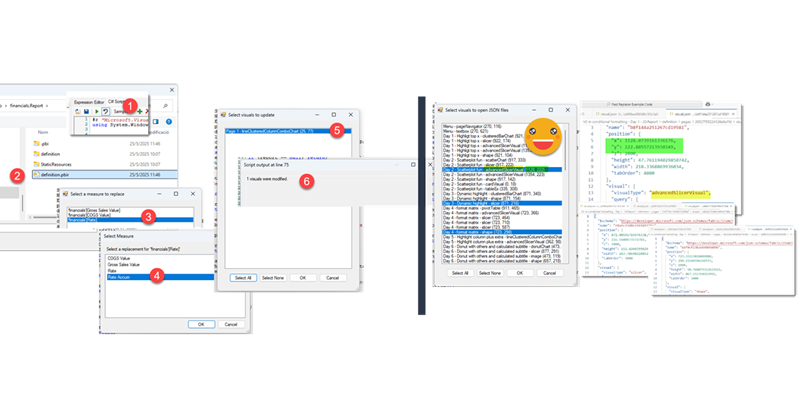
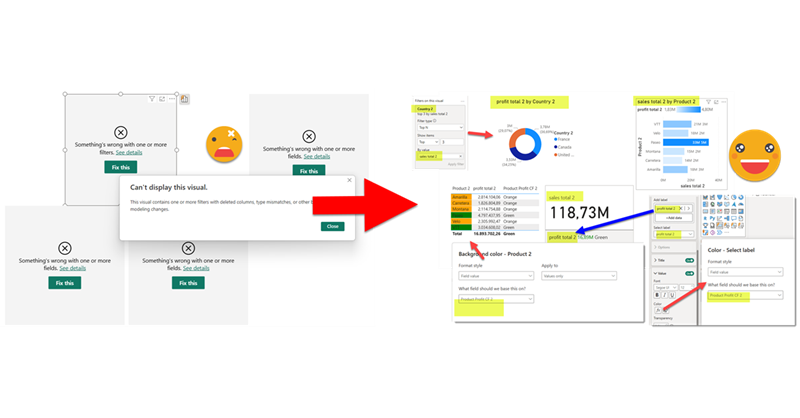
In comparison with my previous post, this one was an absolute breeze to write. Just an idea, some little tweaking with ChatGPT and GitHub CoPilot. Both come from the daily little miseries of daily with Power BI. One is replacing fields in a visual, the other one is finding the visual.json file of certain visual to see how to tackle that bit of configuration you want to change. Let’s get to it.
Continue Reading..Our Blog
This is quite crazy. I was trying to write a quick blog post to get back in swing over here, so I thought of a stream lineddd approach set maximum and minimum values for axis to properly show data labels, with a calc group and so on. Then it was impossible for me to sshow an example of the problem I was trying to solve. But then worse. I realized that you can now use visual calculations for those! So my approach was dobsolete before I presented it to the world. Of course I wanted to do something, and as usual I’m very much about automating stuff. Would it be possible to automate the creation of visual calculations?? Well, for that I would need to really parse the visual.json files of the new pbir reports. I have played around modifying the report layer before, but this time I had to do it for real. Instead of creating new stuff, I wanted to look at was already created! Time to tackle all those little jsons.
In this post I’ll explain how I authored a script that detects broken references in PBIR reports, asks the user for replacements, and then fixes the report. However, this is just the excuse, the way I wrote it opens the door to pretty much any script you can think of to modify the report layer. Let’s get started!
Continue Reading..