I know, I’m back again at validations, but this time is a bit different. Recently I’ve found myselft in a project where the data that was coming in was not fulfilling the sepcified requirements. We tend to thing that data that comes out of a system will always be pristine, but well, at least in one instance it was not. There were some validations set in place in Access + VBA. But then, even if the access was set out to execute every day you have to go in, check the output, and each file had it’s own validation access. Well, not great. Since the patience was running thin (errors kept apprearing in different places) it was decided that a full validatino check was to be set out. Or at least something much deeper than we had now. I figured out that we might be able to build something in Power BI. Data Validation with Power BI. Odd? yes, but hey, you gotta do what you gotta do.
Since there was A LOT of validations to be done, I decided against building different queries for each kind of validation as it would be a nightmare to navigate. So I decided to read the different tables as they come and rather do the validations with measures. All measures where built in a way so that when everything is fine they return blank and when there are some problems, then they return the number of rows that do not fullfill the requirement.
So far so good. In order for you to get an idea of what I did, I will replicate here with 3 tables and some business logic. The real thing is way more twisted, believe me.
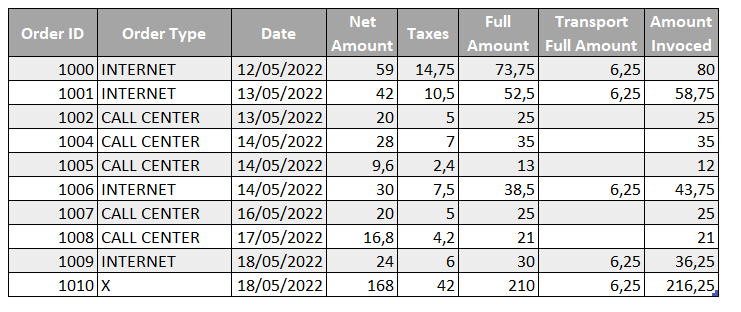
ORDERS:
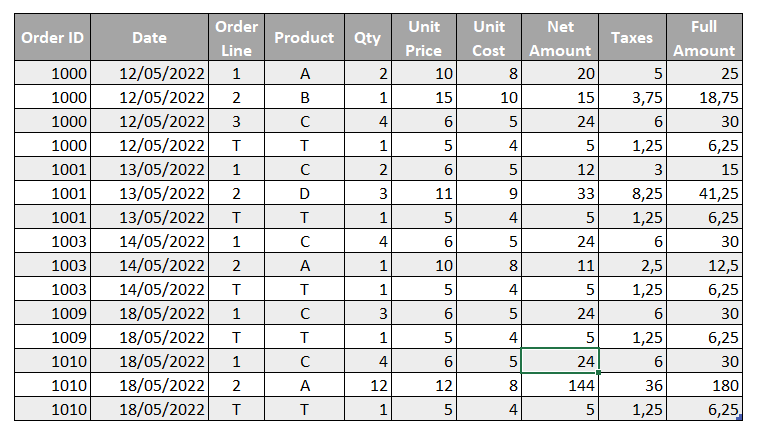
INTERNET ORDERS DETAIL:
WAREHOUSE:
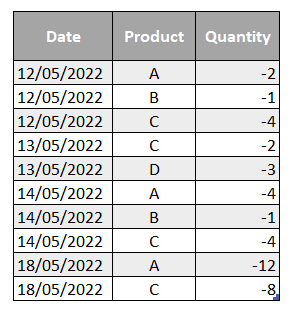
As we can see in the Orders table we get a column for transportation while in the orders detail we get a row for it. As the name implies we only have the internet orders there. Also, let’s imagine that the call center orders are only digital goods so they don’t have transportation costs and do not show on our Warehouse table. The warehouse table has a daily row per product when there has been an exit from the warehouse. Everything ships on order date — let’s assume so.
The goal of the measures is to see if there are any visible rows that do not follow the business rule. So to make things easier, let’s build first the measures to count the visible rows. It’s just COUNTROWS(‘table name’) but if you want to go super quick just use this tiny script. Store it as Custom Action, right click on the selected tables and boom, you have your rows measures.
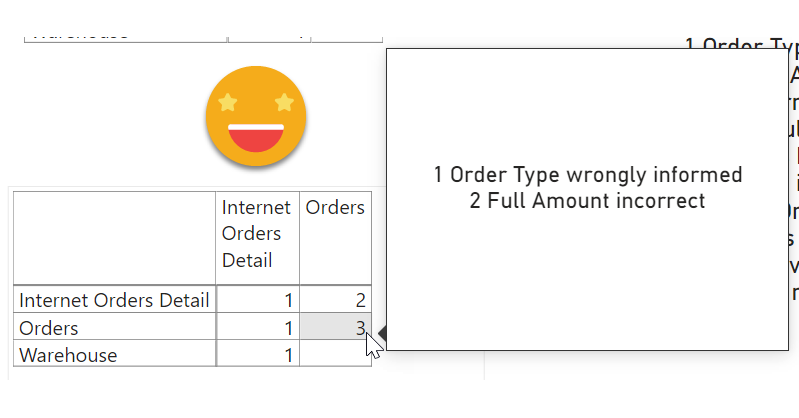
Now, for instance we might want to be extra sure that now rows have values other than «INTERNET» or «CALL CENTER». Our measure would look something like:
Order Type wrongly informed :=
CALCULATE (
    [Rows of Orders],
    KEEPFILTERS ( NOT 'Orders'[Order Type] IN { "INTERNET", "CALL CENTER" } )
)
Here the keepfilters part is to ensure it will not override the external filters if we put the measure in a table where Order Type column is used. Luckily enough no issues on this column though.
Now we might want to double check that the Full Amount is the Net Amount + Taxes.
Full Amount incorrect :=
COUNTROWS (
    FILTER (
        'Orders',
        'Orders'[Net Amount] + 'Orders'[Taxes] <> 'Orders'[Full Amount]
    )
)
Remember the goal is to detect any rows that do not fulfill the rules. We could check a number of other things, like the full amount invoiced, also that all values are greater than 0 or any basic rule that you can think of.
So far these two mesures return blank so all is good. We could continue with internal checks for the Internet Orders Detail table and even the Warehouse even if there’s not that much logic there.
Now how could we set a check between two tables? Let’s first check that all Internet orders are indeed listed in the internet orders detail. Probably with orderid is enough, but let’s check also for the date. Before we do that though, we’ll create a calculated table to store the measures of comparing Orders vs Internet Orders Detail (in this order). You can create a table with the expression
Orders vs Internet Orders Detail = FILTER({BLANK()}, FALSE)
And now the measure can be something like:
Internet Orders not in Internet Order Detail: =
VAR internetOrders =
    CALCULATETABLE (
        SUMMARIZE ( 'Orders', 'Orders'[Order ID], 'Orders'[Date] ),
        KEEPFILTERS ( 'Orders'[Order Type] = "INTERNET" )
    )
VAR internetOrdersNotInDetailPage =
    FILTER (
        SUMMARIZE (
            'Internet Orders Detail',
            'Internet Orders Detail'[Order ID],
            'Internet Orders Detail'[Date]
        ),
        NOT CONTAINSROW (
            internetOrders,
            'Internet Orders Detail'[Order ID],
            'Internet Orders Detail'[Date]
        )
    )
RETURN
    COUNTROWS ( internetOrdersNotInDetailPage )
If you are like me you’ll probably create probably the opposite of what you wanted to do, but don’t work because we want to check both ways, so you can keep the measure.
Now the fact that the order is there does not mean that the amounts match, and here is where things get a bit trickier. We will have to aggregate the detail page by orderid and date and by those who match, we’ll check if they also match if whe check the amount columns as well. This way we do not double count those that do not even appear on the detail table.
To create the measures for each of the columns I hope you are using a script as well — life is too short to be creating SUM measures! This probably the most famous C# script around. Store it as a Custom Action, select all the amount columns of the detail table, right click on them and select the custom action you just created — baaam. We are not going to use them all, but it can’t hurt to have them ready right?
So how can we check the number of internet orders that exist on both tables and that do not match the amounts?
As things get tricky (and well before that tbh) I type things first in a DAX query and see what comes out. Then I modify it a bit to return a scalar and there I have my measure. In this case the query would be something like this
EVALUATE
VAR internetORdersFromDetail =
    SUMMARIZE ( 'Internet Orders Detail', 'Orders'[Order ID], 'Orders'[Date] )
VAR internetOrdersWithAmountsFromDetail =
    CALCULATETABLE (
        ADDCOLUMNS (
            SUMMARIZE (
                'Internet Orders Detail',
                'Internet Orders Detail'[Order ID],
                'Internet Orders Detail'[Date]
            ),
            "@Net Amount", [Sum of Net Amount],
            "@Taxes", [Sum of Taxes],
            "@Full Amount", [Sum of Full Amount]
        ),
        'Internet Orders Detail'[Order Line] <> "T"
    )
VAR internetOrdersWrongAmounts =
    FILTER (
        'Orders',
        'Orders'[Order Type] = "INTERNET"
            && CONTAINSROW ( internetORdersFromDetail, 'Orders'[Order ID], 'Orders'[Date] )
            && NOT CONTAINSROW (
                internetOrdersWithAmountsFromDetail,
                'Orders'[Order ID],
                'Orders'[Date],
                'Orders'[Net Amount],
                'Orders'[Taxes],
                'Orders'[Full Amount]
            )
    )
RETURN
    internetOrdersWrongAmounts
This time this returns a row! we found something

We would get an equivalent result if we did it the other way around, but that would be double counting problems. Anyway, let’s do a couple more with the Warehouse table and then we’ll get to the interesting part — how can we handle this sprawling number of measures, and how can we *show* the data problems.
For the warehouse we’ll also make sure that all date-products exist in both sides with one measure, and then we’ll check if in such cases the quantity is the same (with a negative sign).
In the pbix you’ll find the measure from both sides of the story, here is the one checking that all the Ids (date + product) present in the Warehouse table exist in the Internet Order Details table.
Warehouse Ids not in Internet Order Details :=
VAR internetIds =
    FILTER (
        SUMMARIZE (
            'Internet Orders Detail',
            'Internet Orders Detail'[Date],
            'Internet Orders Detail'[Product]
        ),
        'Internet Orders Detail'[Product] <> "T"
    )
VAR warehouseIdsNotInInternetOrders =
    FILTER (
        SUMMARIZE ( 'Warehouse', 'Warehouse'[Date], 'Warehouse'[Product] ),
        NOT CONTAINSROW ( internetIds, 'Warehouse'[Date], 'Warehouse'[Product] )
    )
RETURN
    COUNTROWS ( warehouseIdsNotInInternetOrders )
This also reveals that on 14th of may some quantity of the B produt left the warehouse without any internet order to back it up. If its a data problem or a warehouse security problem is beyond me at this point.
So we could continue going for a long while, but before that a cold feeling goes through the spine and and an idea rushes through the mind. «And now what». You have all this wonderful measures, so what are you going to do it? put each in a card and come everyday to check how are they doing? If you think fancy you have probably thought about pining those card visuals into a Dashboard (Dashboard, the actual thing) so that you can put an alarm if any of them goes above 0. But remember we are talking here about A LOT of measures, so probably you don’t want to spend your days creating alarms, and receiving a tons of emails each day (we are building this because we are finding way to many little things, remember).
Now, what is to be done then? Similar to what I discussed in my article on the data problems button, it is good to have a measure that will sum all your problem-detecting measures. Actually now that I think of it is the same approach as in the Referential Integrity managment article too. In that article we also got another measure that explained what are the problemswith our model. I’d like to have something like that too. Here is your total number of issues, and here is the breakdown by typology. Neither measure would be too complex to build: One is just the sum of all measures, and the other follows a pattern
total issue description =
    IF([wrongly informed rows] > 0,
        [wrongly informed rows] & " Wrongly informed rows" & UNICHAR(10)
    ) &  IF([rows without equivalent] > 0,
        [rows without equivalent] & " rows without equivalent" & UNICHAR(10)
    ) & ....
This way if there are no errors, there is no description either.
The small problem with this is that such a measure are a pain to write and a pain to maintain. What if a new measure gets created, you need to modify it so it goes together with the similar measures. What if you change the name? you should go and update the description message. If you delete a measure you also need to go a and fix it. A pain.
To put matters in perspective, you will need two levels of «aggregation», in one hand you want to add all the measures of a given scope (internal checks of Internet Order Details for example, or Warehouse vs Internet Order Details). And then you want the overall counter and description.
But then there’s one more thing. Once you present your unsettling numbers to your colleagues, some will say — «ok, there are 1000 rows where the full Sales Amount is not correctly informed, but for me that’s one error, not 1000». Oh well, I get it.
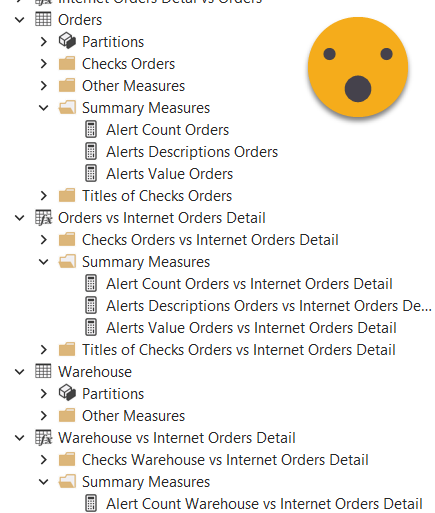
Instead of making my life miserable managing measures up and down, I decided to get down to it and wrote myself a C# Script! In order to let the script get to the correct measures (not all measures are checks) I put all the measures that are checks in a display folder that starts with «Checks » like «Cheks Warehouse vs Internet Order Details». Since you’ll probably want to show the errors of Warehouse vs Internet Order Details in a different Report sheet as the Internet Order Details it’s good that all these measures each scope of measures sits in a different table (or measure table) inside their corresponding display folder. This way the script will generate different summary measures for them.
After some trial and error I realized that if I standarized the names of the tables, I could generate like a matrix with all the possible combinations, and from there, using my «arbitrary table» blog post I could put the measures where the names are— and even the description as tooltip! how cool is that?! I could even give a vision with the check count, and a vision with the check * affected rows count. OMG OMG OMG. For that I would even need to call a Custom Action programatically! Yes, I want a dynamic measure calculation group that includes all the summary measures from the different tables.
Anyway, before running anything in Tabular Editor tidy up your state and put all the measures that are checks into the display folder that starts with «Checks » (if you don’t like that you can change the prefix in the code). It should look something like this:
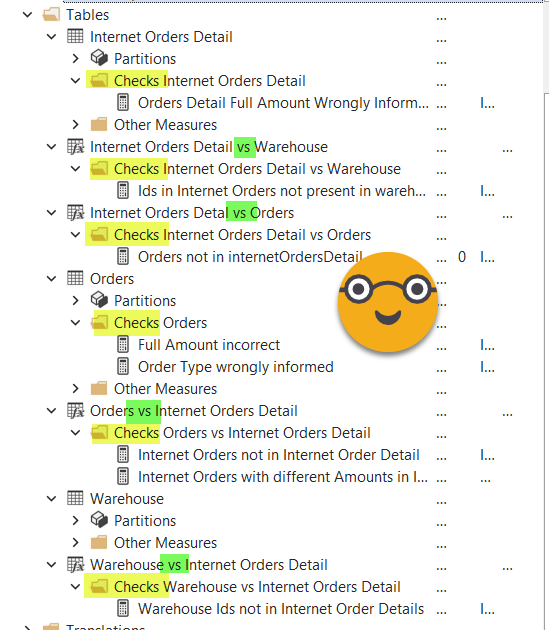
Notice also that table names are standardized and are either the orignal tables or new measure tables that are Name Table 1 vs Name Table 2. Since the Summary measures will build their name based on that better to get it right. (there are a few typos that caused me some pain down the road, don’t be like me, check your names).
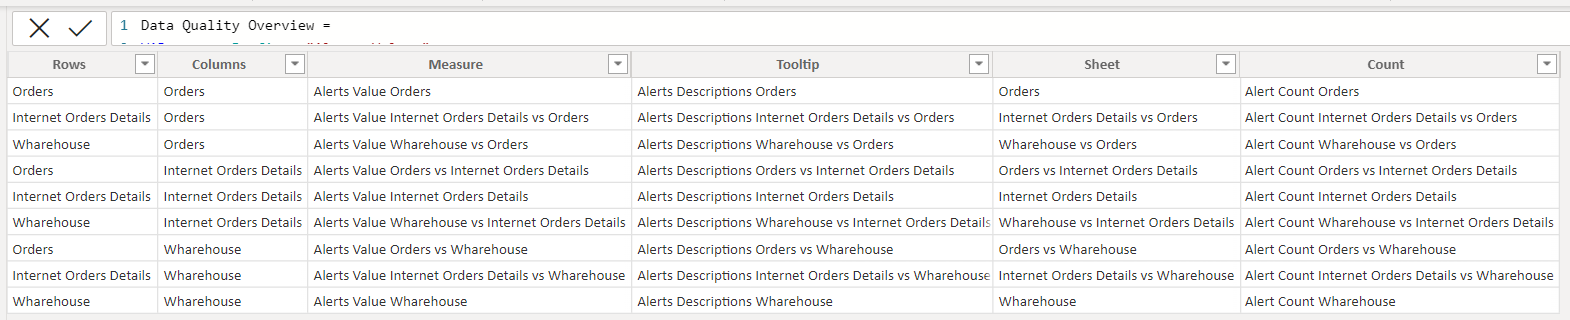
Now we need a place to tore the Overall Measures, so we can also use that table I was talking you about. We build yet another calculated table, but this time with rows and columns. (Check the names that you are using here! yes, I had typos here too).
Data Quality Overview =
VAR measurePrefix = "Alerts Value "
VAR descriptionPrefix = "Alerts Descriptions "
VAR alertCountPrefix = "Alert Count "
VAR tRows = { "Orders", "Internet Orders Details", "Warehouse" }
VAR tRowCrossJoin =
    CROSSJOIN (
        SELECTCOLUMNS ( tRows, "Rows", [Value] ),
        SELECTCOLUMNS ( tRows, "Columns", [Value] )
    )
VAR result =
    GENERATE (
        tRowCrossJoin,
        VAR rootName =
            IF ( [Rows] = [Columns], [Rows], [Rows] & " vs " & [Columns] )
        VAR measureName = measurePrefix & rootName
        VAR descriptionName = descriptionPrefix & rootName
        VAR sheetName = rootName
        VAR measureCountName = alertCountPrefix & rootname
        RETURN
            ROW (
                "Measure", measureName,
                "Tooltip", descriptionName,
                "Sheet", sheetName,
                "Count", measureCountName
            )
    )
RETURN
    result
This will generate a pretty bland looking table, but that is exactly what we need. It basically creates all combinations between the names of the tables, and from there 4 columns that are either the name of the table with a prefix or the names of both tables (with a » vs » connecting them) with the same prefix. We’ll see the reason in a second.
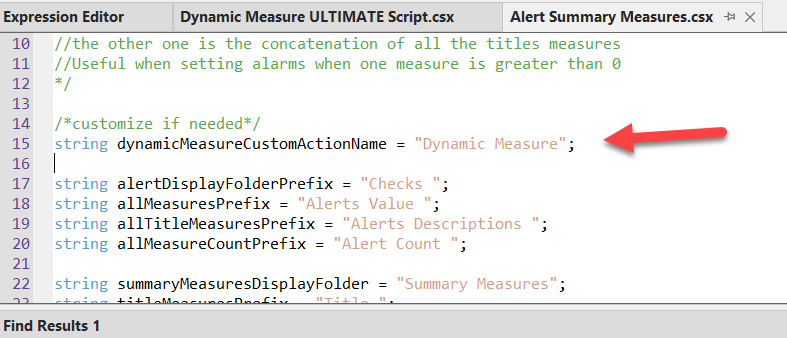
If you have not done that yet, go to github and get the latest dynamic measure calculation group script . And I say the latest because we’ll need all three dummy measures. Store the script as a custom action or Macro called «Dynamic Measure». (Actually do go and download it again as I incuded a modification to run smothly in this use case, and that’s the ability to run without any selected measure just to create the calculation group table)
Now go to github again and grab the Alert Measures Summary script. (If you called the dynamic measure custom action something else, change the first variable of the code — haven’t figured out a way to do that programatically… yet).
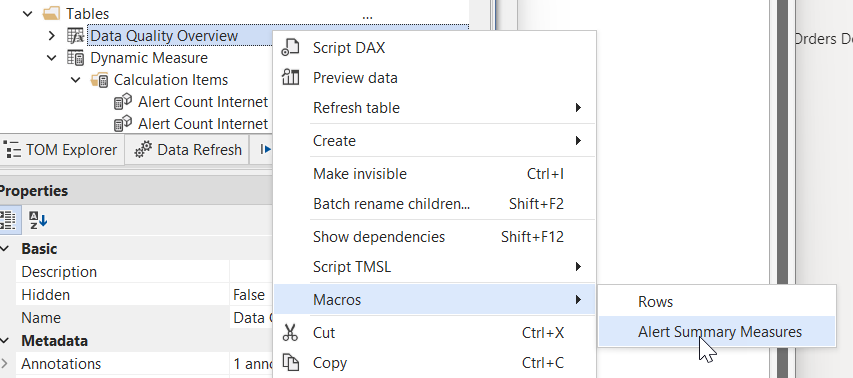
Store this one as a Custom Action because chances are you’ll have to run it quite a few time as you keep defining new checks or deleting wrong ones. This Custom Action should run on a table, which is the table where the overall measures will be stored.
In the moment of this writting the script cannot be executed with the latest version of TE3 as there is an issue with the Error function. In TE2 it does not cause an error, but the programatic call of a Custom Action is completely ignored, with or without the Roslyn compiler.
If you are a TE3 user, you can run the script if you download a portable version 3.2.3 to quickly run this before Daniel fixes it in the next release (I wonder if this blog post will see the light before that tbh). If you are a TE2 user, I guess Daniel will fix it too I’m sure, but for the time being you can check if it runs well in a previous version or just go ahead and create the dynamic measure calculation groups with all the measaures you find in the displayfolder «Summary Measures» that you’ll find in each table. Remember you can just rerun the script for each new grup of measures (TE2 does not allow selection from more than a single table)
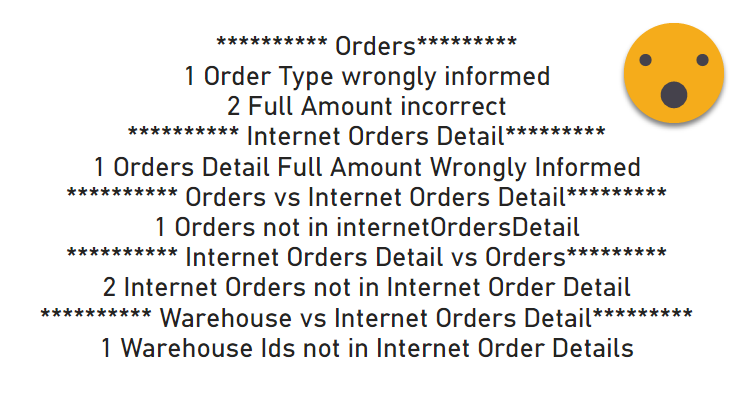
The first thing we can do is to show the Total Alerts Description measure in a card. This will give already a lot of information about what is going on.
Ok, so now we want to use our calculated table to show the values corresponding to the names that we have built there… We want to do what we did on the Arbitrary table blog post but 3-fold. We want the dummy measure to get the Alert Value measure, the dummy 2 to get the Alert Description and the dummy CF the Alert Count — it’s not conditional formatting here, but it will work just as fine. To get this logic into the same calculation item we’ll go with a switch statement. If you haven’t yet, please read the original blog post to understand the idea and how I got there (spoiler: the community rocks!).
---------------------------------------------
-- Calculation Group: 'Measure Name to Value'
---------------------------------------------
CALCULATIONGROUP 'Measure Name to Value'[Measure Name to Value]
    Precedence = 1

    CALCULATIONITEM "Measure Name to Value" =
        SWITCH (
            TRUE (),
            ISSELECTEDMEASURE ( [Dummy] ),
                VAR measurename =
                    SELECTEDVALUE ( 'Data Quality Overview'[Measure] )
                RETURN
                    CALCULATE (
                        SELECTEDMEASURE (),
                        'Dynamic Measure'[Dynamic Measure] = measurename
                    ),
            ISSELECTEDMEASURE ( [Dummy 2] ),
                VAR measurename =
                    SELECTEDVALUE ( 'Data Quality Overview'[Tooltip], BLANK () )
                RETURN
                    IF (
                        ISBLANK ( measurename ),
                        [Total Alerts Description],
                        CALCULATE (
                            SELECTEDMEASURE (),
                            'Dynamic Measure'[Dynamic Measure] = measurename
                        )
                    ),
            ISSELECTEDMEASURE ( [Dummy CF] ),
                VAR measurename =
                    SELECTEDVALUE ( 'Data Quality Overview'[Count] )
                RETURN
                    CALCULATE (
                        SELECTEDMEASURE (),
                        'Dynamic Measure'[Dynamic Measure] = measurename
                    ),
            SELECTEDMEASURE ()
        )
        FormatString = SWITCH (
            TRUE (),
            ISSELECTEDMEASURE ( [Dummy] ),
                VAR measurename =
                    SELECTEDVALUE ( 'Data Quality Overview'[Measure] )
                RETURN
                    CALCULATE (
                        SELECTEDMEASUREFORMATSTRING (),
                        'Dynamic Measure'[Dynamic Measure] = measurename
                    ),
            ISSELECTEDMEASURE ( [Dummy 2] ),
                VAR measurename =
                    SELECTEDVALUE ( 'Data Quality Overview'[Tooltip] )
                RETURN
                    CALCULATE (
                        SELECTEDMEASUREFORMATSTRING (),
                        'Dynamic Measure'[Dynamic Measure] = measurename
                    ),
            ISSELECTEDMEASURE ( [Dummy CF] ),
                VAR measurename =
                    SELECTEDVALUE ( 'Data Quality Overview'[Count] )
                RETURN
                    CALCULATE (
                        SELECTEDMEASUREFORMATSTRING (),
                        'Dynamic Measure'[Dynamic Measure] = measurename
                    ),
            SELECTEDMEASUREFORMATSTRING ()
        )
So we now build a matrix and put the «Row» column in the rows section, the «Column» column to the column section and the «Dummy» measure to the values section. We apply the calculation item from our brand new calculation group «Measure Name to Value». And we do some cosmetic stuff to the matrix to make it look good.
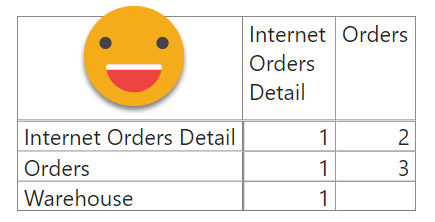
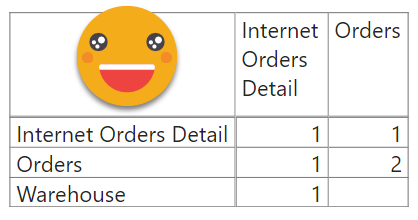
This matrix returns the number of checks * affected rows. To build the Matrix that shows the number of checks that return a number greater than 0, we’ll just replicate the matrix and replace «Dummy» by «Dummy CF».
Looking at the description card it’s not that hard to see what each of this numbers mean, but let’s make it easier. In a new Page, set it up as tooltip, put a card, and inside the card drag Dummy 2. Now configure the matrix to use the new tooltip report page.
That’s pretty cool don’t you think?
Now probably the next question is, «Oh yes? Show me.» It is possible to make a button that will dynamically bring you to any page showing the detail, if the page follows the same stantard (table name or table name 1 vs table name 2). However that proved inefficient as it requires two clicks, one on the matrix to define what you whant to see, and one on the button to get to the other page. I eventually realized that bookmarks where the way to go.
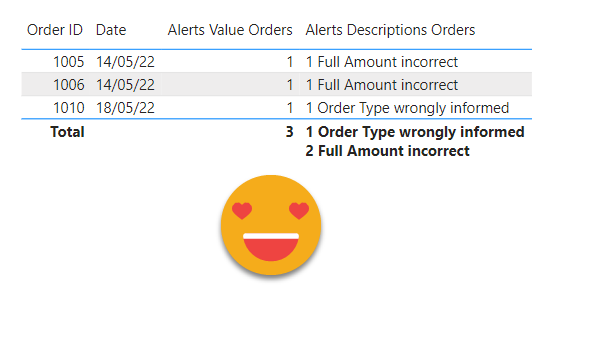
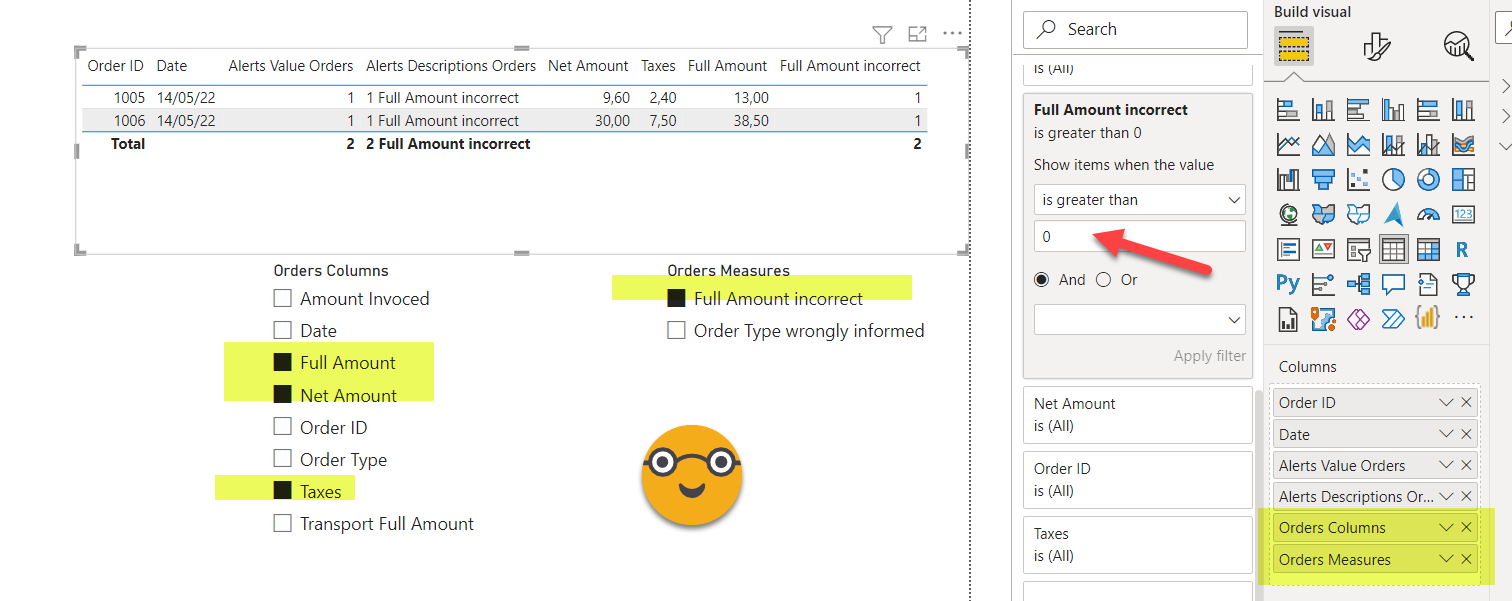
Here’s the thing, the measures created by the script are also great to explain what happens in detail. In a new sheet called «Orders» let’s put a table, and drag there the main ID columns from the Orders table, say Order ID and Date. Then drag there as well the «Alerts Value Orders» measure that you’ll find in the Summary Measures displayfolder fo the Orders table. And while you are at it drag also the «Alerts Description Orders» measure. This one gives you for each row, all de detail of what is wrong with that row. And also for the total! Go on the filter pane and set the «Alerts Value Orders» to be greater than 0, so you see all the problematic rows and where everything comes from!! isn’t it beautiful?
Of course if your list is longer than this you might want to be able to see the rows affected by each alert. Here I’ve taken different routes. On my first table I had a ton of measures, and different columns involved in the alert. So I built a Field Parameter for all the columns of the table and another one with all the checks. Add them both to your table. Then you go check by check and select all the relevant columns from the field parameter of the colums and the measure from the checks. And then you go to the filter pane and set the specific measure to be also greater than 0 so you’ll only see the rows affected by that check.
Once you have everything in place, create a bookmark with the default options! You don’t want to do that every time you want to why do we have an alert. Repeat for each check of that table and create one extra bookmark to see all the checks combined. If you don’t have all that many measures and columns (or maybe if you do have too many measures and columns and field parameters start failing you) you may just add all the columns and measures in the table and may also work for you.
Then you can group all these bookmarks in a «Orders» group. Then you can create a bookmark navigator and select the Orders group so that only those bookmarks are displayed.
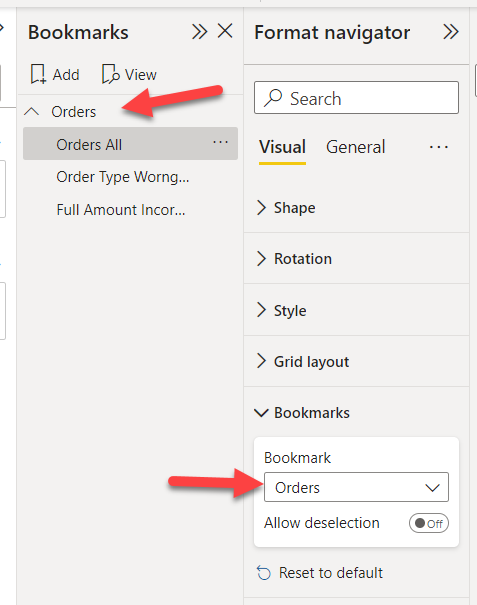
Then you can see any of the checks in one click. Sweet!
So this is pretty cool! In real life this sort of report might get real slow, so you might want to break it down in a few datasets, each comparing a few tables only. Let’s say I’m about to do this because I’ve already caused a couple of super-crashes on desktop when adding yet another measure. Of course that depends also on how twisted your business logic is.
Am I saying we should validate data in Power BI ? No. But in this case I’m not the owner of the pipeline that creates the data. I’m just the consumer. I did this to make my case clear and to have sort of an alarm if any of the known checks returns a number. The idea is that the provider will fix the processes so that my report will return blank everyday, and I’ll be happy with it. Until that day comes, I want to check personally that things are indeed ok. Once you’ve found quite a few data mishaps is hard not to check so we’ll see how long we keep this running.
I’m sure there other ways to go about it, some involving power query, some without … Open to learn from other approaches. I hope mine was at least enjoyable to follow.
If you want to play with the file, here it is