
Calculated tables are not used often, because after all, it only combines data that you already have, right? Well, I didn’t use them often, until recently.
I was shown an excel chart displaying market share among top contenders, but including CY vs PY, then CYTD vs PYTD, then MAT vs MAT-1, and then the last 12 months as individual points. «This is what we would like to have»
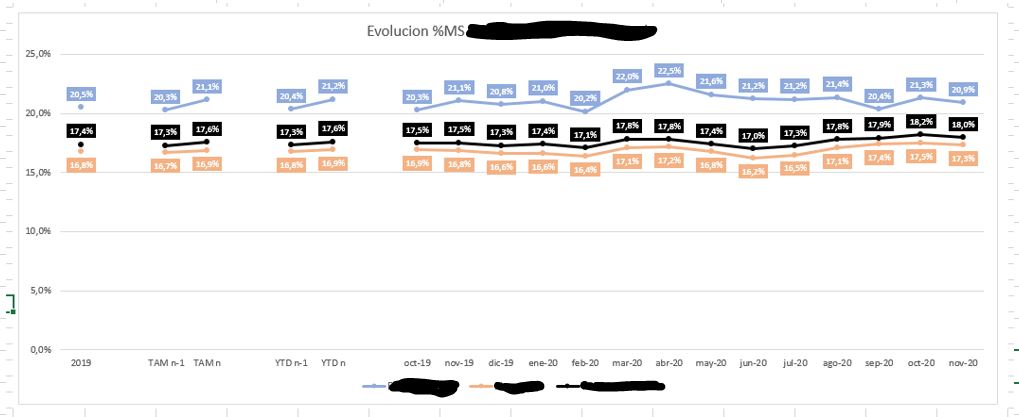
I started experimenting with a large calculation group that contained 18 time calculations, not only that, taking advantage of the formatstring expressions I started playing with the idea of having a dynamic X axis that instead of showing categoric «CY» for current year and «PY» for previous year it would show me the actual year for the active filter context. So far so good. The thing is that with real data, it was slow. Not only that, eventually I would get an error saying «Out of memory». So I had to start over with fresh ideas.
In SQL I would often materialize views to speed up read performance, so in DAX world you can do something very similar which is creating calculated tables. If I precalculated the values I wanted for my chart, then I could have my chart. Of course I could not precalculate all combinations of filters, but at least I could have the picture for each year.
I decided I needed a year column, a column with my time calculation (CY, PY, YTD, PYTD… ), a column with manufacturer, and a column with the market share for that year, manufacturer and the time calculation using the year column as filter context, so that when year column is «2020», calculation column is «PY», and manufacturer is X, market share column shows market share of X manufacturer for 2019. Not only that, while we’re at it I decided it would be nice to have an extra column with the label that I would like to use. For the same example as before this Label column should show «2019».
Used to just dumping the calculation group column wherever I wanted it to act, I tried to just include it in my calculated table, but that didn’t work. And the error was so weird. But of course it didn’t work. Calculation groups always act as a FILTER. What was I trying to filter by putting them directly as a column? Ok, so I needed to use the calculation groups inside a CALCULATE statement of Market Share column. But I still needed to have a column that would contain the calculation name so to say. So using a technique from Alberto Ferrari in this moment of this video I created a table that contained the names of the different calculation items of my calculation group and their order. Now I had the elements I needed, I thought.
Update! thank you Renato Lira for bringing it up: you can use calculation group as a column in a query (i.e. to create a table-like result) so it’s not true what I was claiming, but it turns out you need to follow the same workaround to be able to apply the calculation groups in a way that DAX understands to be non type-variant, which is a no-go for calculated tables as explained later on this same post. So I created a small calculated table replicating the calculation group names and ordinal number using a technique from Alberto Ferrari in this moment of this video. Now I could create rows for all the combinations.
This would be my base:
EVALUATE
CROSSJOIN (
    DISTINCT ( 'Dim Calendario'[Año] ),
    DISTINCT ( 'Dim Marca'[Fabricante (groups)] ),
    DISTINCT ( 'Aux Time Intelligence Calculation Names' )
)
To add market share, I would use calculate of my measure [Market Share %] using the calculation group item equal to my third column, Time intelligence Calculation Name.
However something like
EVALUATE
ADDCOLUMNS (
    CROSSJOIN (
        DISTINCT ( 'Dim Calendario'[Año] ),
        DISTINCT ( 'Dim Marca'[Fabricante (groups)] ),
        DISTINCT ( 'Aux Time Intelligence Calculation Names' )
    ),
    "Market Share 1",
        CALCULATE (
            [Market Share Placeholder Measure],
            'Aux Time Intelligence v2'[Time Calculation] = [Calculation]
        )
)
does not work. It says «Cannot find column [Calculation] or can’t be used in this expression». Oh well. But it must work if you use a variable so is not so bad, I thought.
what about this?
EVALUATE
ADDCOLUMNS (
    CROSSJOIN (
        DISTINCT ( 'Dim Calendario'[Año] ),
        DISTINCT ( 'Dim Marca'[Fabricante (groups)] ),
        DISTINCT ( 'Aux Time Intelligence Calculation Names' )
    ),
    "Market Share",
        VAR calc = 'Aux Time Intelligence Calculation Names'[Calculation]
        VAR result =
            CALCULATE (
                [Market Share Placeholder Measure],
                'Aux Time Intelligence v2'[Time Calculation] = calc
            )
        RETURN
            result
)
This is when it gets weird. Because that worked perfectly on DAX Studio. but then it failed when I tried to create a table with that definition inside Power BI. The error however gave me the hint:»The DAX expression for calculated table Test results in variant data type for column Market Share. Please modify the calculation such that the column has a consistent data type». Ok, it kind of makes sense. When you use calculate with a calculation group, who knows what will come out of it, so DAX says, I’m not making a table if I don’t know what type of data will this column be. So I added an extra thing at the end to ensure it is always a number and Dax was happy. Just to be extra sure I created my calculation group as a replacement of the selected measure, which is just a placeholder so that things happen.
EVALUATE
ADDCOLUMNS (
    CROSSJOIN (
        DISTINCT ( 'Dim Calendario'[Año] ),
        DISTINCT ( 'Dim Marca'[Fabricante (groups)] ),
        DISTINCT ( 'Aux Time Intelligence Calculation Names' )
    ),
    "Market Share",
        VAR calc = 'Aux Time Intelligence Calculation Names'[Calculation]
        VAR result =
            CALCULATE (
                [Market Share Placeholder Measure],
                'Aux Time Intelligence v2'[Time Calculation] = calc
            )
        RETURN
            IF ( ISNUMBER ( result ), VALUE ( result ), BLANK () )
)
Since the calculated table contains the keys to the different dimension tables, it can be connected to them and thus respond to the filters without issue. Only when connecting to the time dimension I got a weird error, so I just made a «year» table, which worked just fine.
And the tough part is over. To create the actual labels I used a different calculation group.
(Update (24-Jun-2021): The labels can be calculated within the same calculation group, just with different logic depending on the measure in scope. The latest iteration of my time calculation script creates such a calc group. However, you will still need the only-names table to avoid the calc group being the last thing applied and being so leaving columns type-variant.)
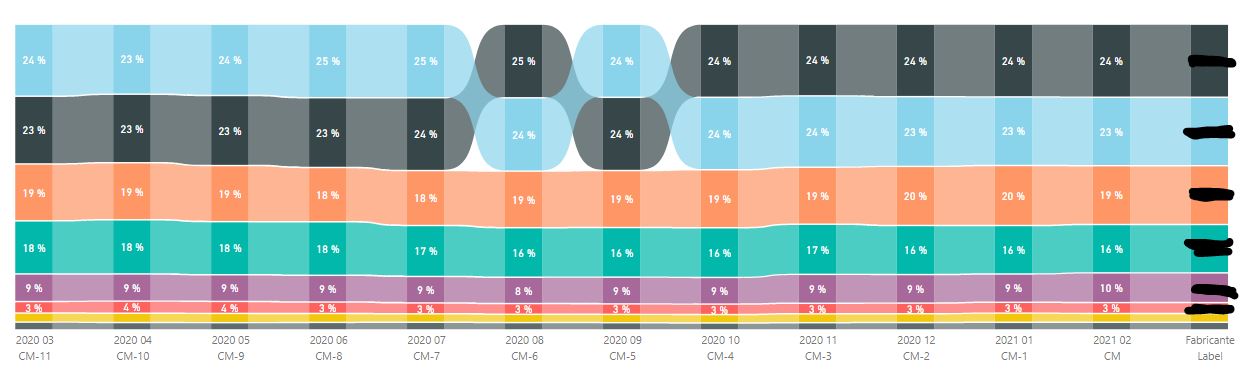
Anyway, with the calculated table I could create my basic chart, at least as a POC that the chart can be created in Power BI. Now I’ll probably have to iterate to make it work for the customer. Probably this article too will need some updates as well.
Here is the running last 12 months values only because if I put all calculations columns are too narrow and data labels are not even displayed (also because I need to add some dummy steps to cut the ribbons to avoid connecting unconnected data points). Since its market share it all adds up to 1 so I think ribbon chart is the best approach as it’s easy to see the ranking and if there’s any change in that ranking . If anybody knows how to make the inter-column space smaller please let me know! I want wider columns, but the only parameters around that do not work as I expected. (I’ve later found that putting data labels to overflow mitigates the problem) The last column has the same values as CM but displays the Manufacturer name, which is cool and easy to read I think. On a later version I even added an extra data point with the same value showing the ranking number (the real reason being to read the manufacturer name more easily).
And that’s it! Thanks for reading all the way to here. Congrats.